Reason to trust

How Our News is Made
Strict editorial policy that focuses on accuracy, relevance, and impartiality
Ad discliamer
Morbi pretium leo et nisl aliquam mollis. Quisque arcu lorem, ultricies quis pellentesque nec, ullamcorper eu odio.
As repeated time and time again by analysts, Bitcoin is currently in no man’s land. The cryptocurrency remains above the $8,500 support while below the resistance region at $10,000-10,500.
Price has responded in kind, flatlining in the low-$9,000s as neither bulls and bears have managed to establish a trend. Yet a volatility analysis predicts that a massive move in the Bitcoin market is brewing.
Related Reading: Once-a-Cycle Bitcoin Bull Signal Just Appeared for the 1st Time Since 2016
Bitcoin Volatility Analysis Suggests An Imminent 30% Move
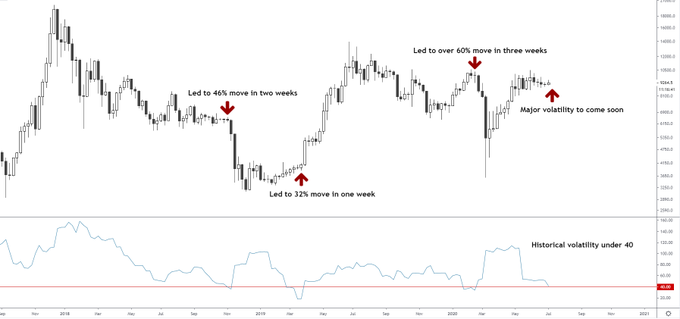
Blockroots co-founder Josh Rager noted on July 12th that Bitcoin’s historical volatility index is currently nearing 40.
This is important as every time “BTC volatility [was] this low, [there was] major price action between 30% to 60% movement in the following weeks.”
The chart below depicts this trend. Before Bitcoin crashed 60% from the $9,000s to $3,700 earlier this year, the historical volatility index briefly dipped under 40. And prior to the Bitcoin price explosion at the start of the 2019 bull run, historical volatility fell under 40.
With volatility reaching crucial lows yet again, it seems almost certain that Bitcoin will see a critical breakout in the weeks ahead.
BTC historical volatility analysis by Blockroots founder and crypto trader Josh Rager (@Josh_Rager on Twitter). Chart from TradingVIew.com
Which Way Will the Breakout Take BTC?
While it’s a common sentiment that Bitcoin will soon see a breakout of macro importance, which way will it take BTC?
Mike McGlone, a senior commodity analyst at Bloomberg Intelligence, is betting on a move to the upside. Recently commenting on Twitter about his Bitcoin outlook, he said:
“Volatility should continue declining as Bitcoin extends its transition to the crypto equivalent of gold from a highly speculative asset, yet we expect recent compression to be resolved via higher prices.”
#Bitcoin Blahs? Benchmark #Crypto Looked Similar Before Past Gains —
Volatility should continue declining as Bitcoin extends its transition to the crypto equivalent of gold from a highly speculative asset, yet we expect recent compression to be resolved via higher prices. pic.twitter.com/XbIMv5AYAf— Mike McGlone (@mikemcglone11) July 2, 2020
He did not explain this point further in the tweet. Yet, attached to his message was a chart showing two things: Firstly, Bitcoin has held the 52-week (one-year) simple moving average in recent retracements. And secondly, the Grayscale Bitcoin Trust (often seen as the foremost institutional investment vehicle for BTC) has seen a strong uptick in buying as of late.
McGlone also noted, though, that he expects Bitcoin’s volatility to decline on a long-term basis in line with mainstream adoption. He commented in a June analysis.
“Maturation, greater depth and plenty more exposure via futures should continue to suppress the first-born crypto’s volatility, clearly keeping it tilted toward price appreciation. We view the benchmark crypto as a resting bull that likely needs something to change significantly in its 10-or-so-year history to not just resume doing what it was doing: appreciating.”
How that will affect Bitcoin’s current price action remains to be seen.
Related Reading: This Unexpected Metric Shows That Crypto Is in a Booming Bull Market
Featured Image from Shutterstock
Price tags: xbtusd, btcusd, btcusdt
Charts from TradingView.com
A Critical 30% Bitcoin Breakout Is Weeks Away: Volatility Analysis


