
Reason to trust
How Our News is Made
Strict editorial policy that focuses on accuracy, relevance, and impartiality
Ad discliamer
Morbi pretium leo et nisl aliquam mollis. Quisque arcu lorem, ultricies quis pellentesque nec, ullamcorper eu odio.
Ripple rallied around 5% and it broke the key $0.1920 resistance against the US Dollar. XRP price is now testing the $0.2000 resistance, which holds the key for a larger upward move.
- Ripple price is trading with a strong bullish bias above the $0.1900 level against the US dollar.
- The price is up close to 5% and it tested the $0.2000 resistance area.
- There is a crucial declining channel forming with resistance near $0.2000 on the daily chart of the XRP/USD pair (data source from Kraken).
- The main hurdle for the bulls is near the $0.2000 area and the 100-day SMA.
Ripple Price Rally Facing Significant Hurdle
This past week, ripple formed a strong support above the $0.1720 level against the US Dollar. XRP started a solid upward move from the $0.1687 swing low and broke many hurdles near $0.1820.
There was a break above the key $0.1900 resistance, opening the doors for more upsides. The pair spiked above the $0.1950 level and the 100-day simple moving average. Moreover, it broke the 50% Fib retracement level of the key downward move from the $0.2151 high to $0.1687 low.
The price ran into a major resistance zone at $0.2000. There is also a crucial declining channel forming with resistance near $0.2000 on the daily chart of the XRP/USD pair.
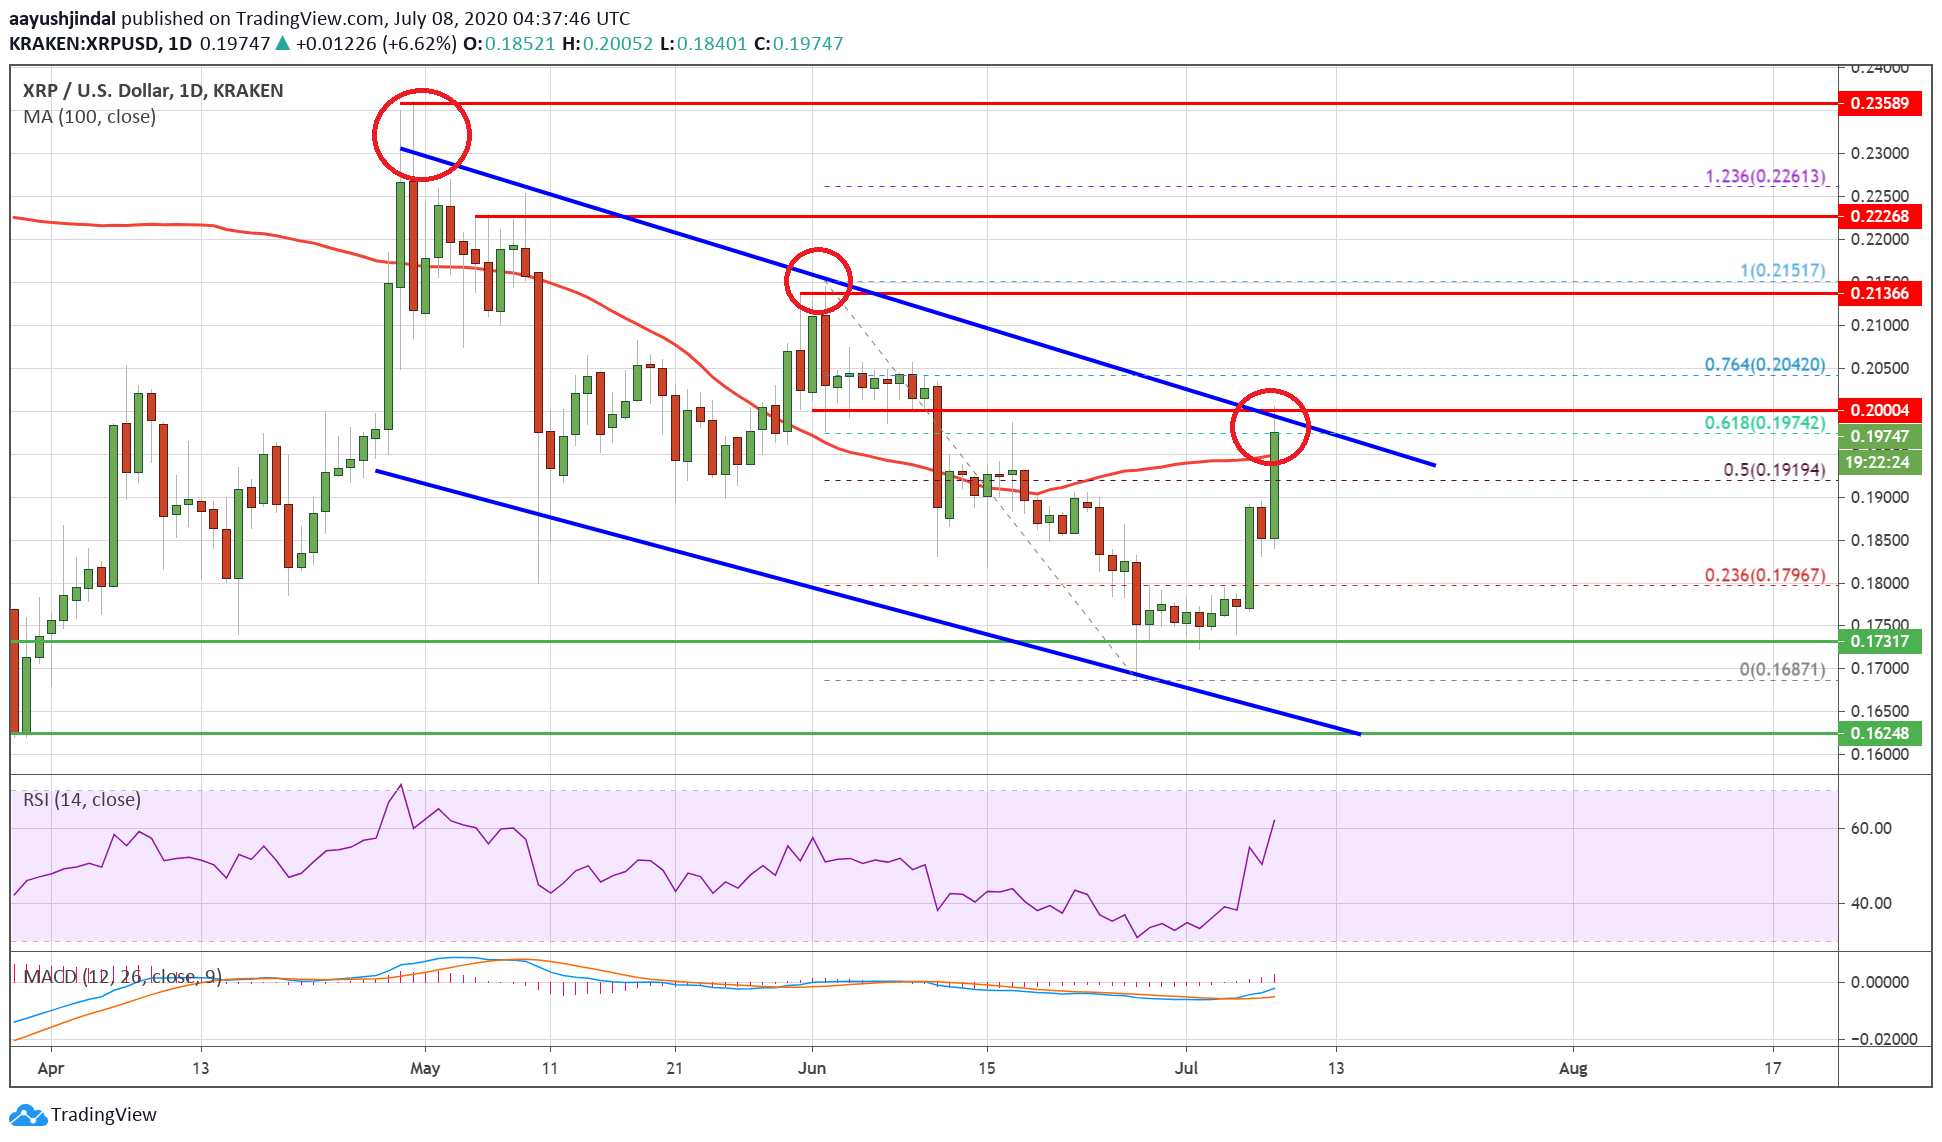
Ripple price tests $0.2000. Source: TradingView.com
The channel resistance is close to the 61.8% Fib retracement level of the key downward move from the $0.2151 high to $0.1687 low. Therefore, an upside break above the $0.2000 level is must for more gains in the coming days.
If there is a daily close above $0.2000, the price could start another rally. The next key resistance is near the $0.2150 level, above which it could revisit the $0.2200 level.
Bearish Rejection in XRP
If there is no upside break above the $0.2000 resistance zone, there is a risk of a bearish reaction. An initial support is near the $0.1900 level.
If ripple fails to stay above the $0.1900 level, the price is likely to resume its decline. In the mentioned case, it could revisit the $0.1820 level in the near term.
Technical Indicators
Daily MACD – The MACD for XRP/USD is gaining momentum in the bullish zone.
Daily RSI (Relative Strength Index) – The RSI for XRP/USD is currently well above the 55 level.
Major Support Levels – $0.1920, $0.1900 and $0.1820.
Major Resistance Levels – $0.2000, $0.2150 and $0.2200.
Take advantage of the trading opportunities with Plus500
Risk disclaimer: 76.4% of retail CFD accounts lose money.


