
Reason to trust
How Our News is Made
Strict editorial policy that focuses on accuracy, relevance, and impartiality
Ad discliamer
Morbi pretium leo et nisl aliquam mollis. Quisque arcu lorem, ultricies quis pellentesque nec, ullamcorper eu odio.
Bitcoin traded as high as $9,377 before starting a downside correction against the US Dollar. BTC is currently up holding the $9,200 support and it could continue to rise steadily.
- Bitcoin is trading in a positive zone above the $9,200 and $9,180 support levels.
- The price is likely to resume its upward move above the $9,300 and $9,320 levels.
- There is a key bullish trend line forming with support near $9,250 on the hourly chart of the BTC/USD pair (data feed from Kraken).
- The bulls are likely to aim a fresh monthly high above the $9,400 level in the coming sessions.
Bitcoin Price Could Test $9,500
Yesterday, there was a decent upward move in bitcoin above the $9,200 resistance against the US Dollar. BTC even surged above the $9,300 level and the 100 hourly simple moving average.
A high was formed near $9,377 before the price started a downside correction. The price declined below the $9,320 and $9,300 support levels. However, it remained well bid above the $9,200 level and the 100 hourly SMA.
A low is formed near $9,205 and the price is currently rising. It broke the 23.6% Fib retracement level of the recent downside correction from the $9,377 high to $9,205 low. On the upside, the $9,300 level is once again acting as a resistance for the bulls.
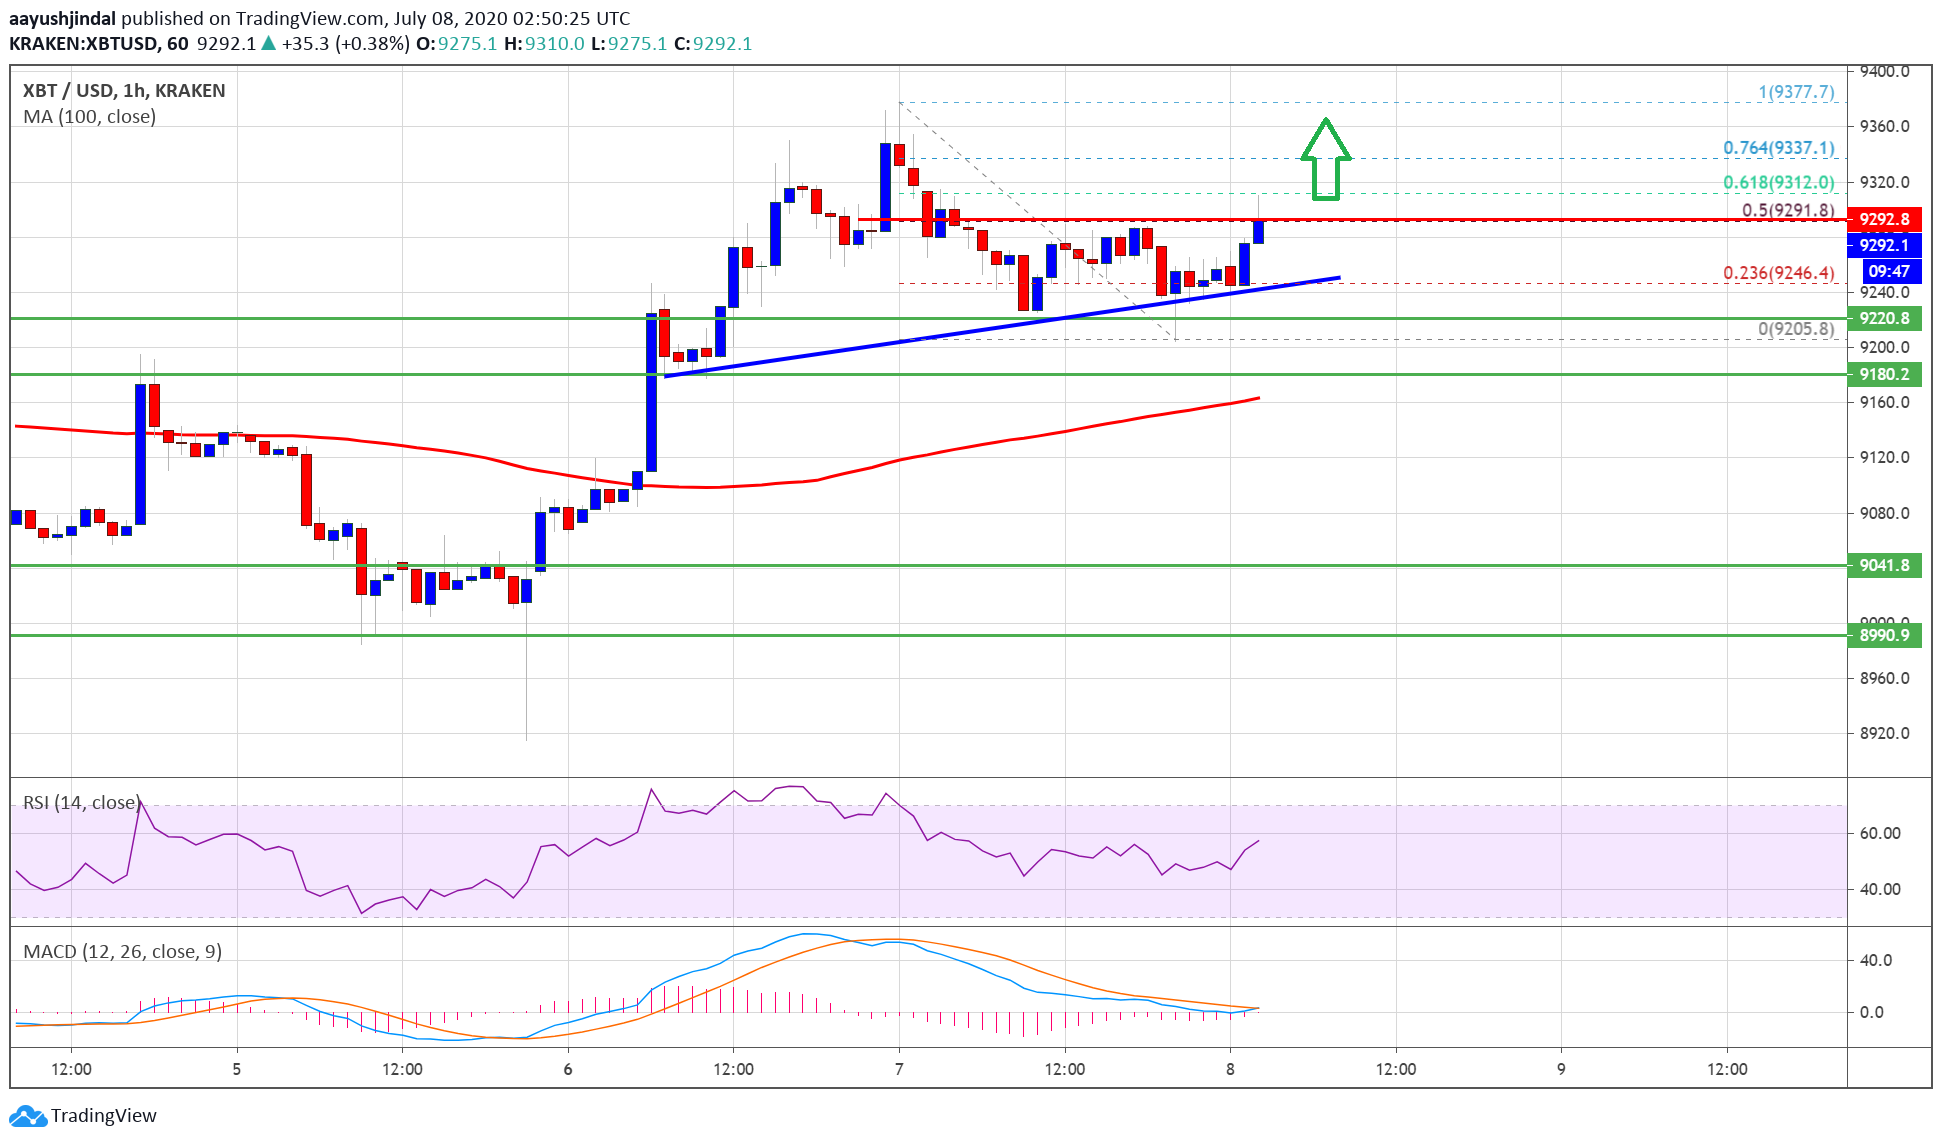
Bitcoin price holding $9,200: Source: TradingView.com
The 50% Fib retracement level of the recent downside correction from the $9,377 high to $9,205 low is also preventing more gains. It seems like there is a key bullish trend line forming with support near $9,250 on the hourly chart of the BTC/USD pair.
If the pair continues higher above the $9,300 and $9,320 levels, it is likely to break the $9,377 high and target a new high. The next immediate resistance is near $9,400, above which the bulls are likely to aim a test of the $9,500 level in the near term.
Bearish Reaction in BTC
On the downside, the trend line support is a major buy zone, followed by the $9,200 support zone. If the price fails to stay above $9,200, it could test the 100 hourly SMA.
Any further losses below the 100 hourly SMA or the $9,150 level could push the price back towards the $9,000 support level in the near term.
Technical indicators:
Hourly MACD – The MACD is slowly moving into the bullish zone.
Hourly RSI (Relative Strength Index) – The RSI for BTC/USD is currently rising towards the 60 level.
Major Support Levels – $9,250, followed by $9,200.
Major Resistance Levels – $9,320, $9,400 and $9,500.