
Reason to trust
How Our News is Made
Strict editorial policy that focuses on accuracy, relevance, and impartiality
Ad discliamer
Morbi pretium leo et nisl aliquam mollis. Quisque arcu lorem, ultricies quis pellentesque nec, ullamcorper eu odio.
Bitcoin is still holding the $9,000 support zone against the US Dollar. BTC is now approaching a crucial juncture and it could either rally above $9,200 or start a sharp decline below $9,000.
- Bitcoin is trading below a couple of important hurdles near $9,200 and $9,220.
- The price seems to be forming a strong support base above the $9,000 support area.
- There is a significant bearish trend line forming with resistance near $9,140 on the 4-hours chart of the BTC/USD pair (data feed from Kraken).
- The pair could start a strong increase if it clears the $9,200 resistance area in the near term.
Bitcoin Approaching Crucial Juncture
This past week, bitcoin made another attempt to gain traction above $9,300 resistance against the US Dollar, but it failed. BTC trimmed gains, and declined below the $9,200 support level and the 100 simple moving average (4-hours).
It even spiked below the $9,000 support level and traded as low as $8,933. Recently, there was a fresh increase above the $9,000 level and it seems like the price is forming a decent support base above the $9,000 level.
There was a break above the 50% Fib retracement level of the downward move from the $9,300 swing high to $8,933 low. Bitcoin price is now facing a major resistance near the $9,150 and $9,200 levels. There is also a significant bearish trend line forming with resistance near $9,140 on the 4-hours chart of the BTC/USD pair.
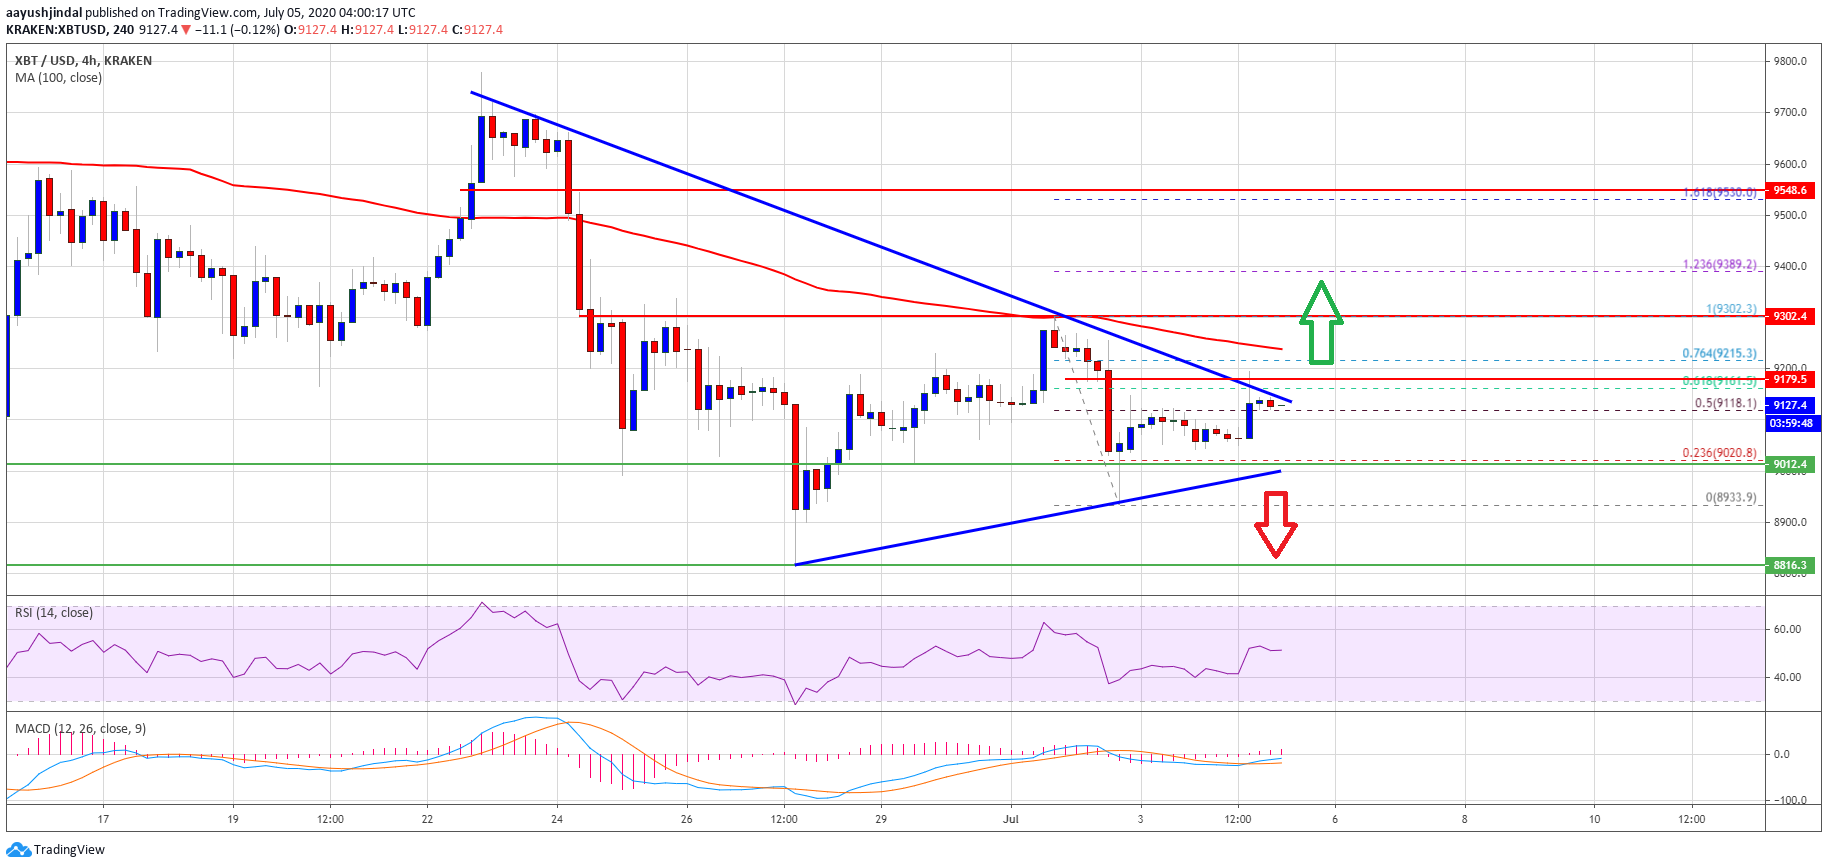
Bitcoin price holds $9,000: Source: TradingView.com
The trend line is close to the 61.8% Fib retracement level of the downward move from the $9,300 swing high to $8,933 low. Above the trend line, the 100 simple moving average (4-hours) is near the $9,220 resistance.
The main resistance is still near the $9,300 level. Therefore, BTC must surpass the $9,200 and $9,300 resistance levels to start a strong increase in the near term. If the bulls succeed, the price might easily rise towards the $9,500 and $9,600 levels.
Downside Break in BTC?
If bitcoin struggles to clear the $9,200 and $9,300 resistance levels, there is a risk of a sharp decline. The first major support is near the $9,000 level and connecting bullish trend line on the same chart.
A successful bearish break below the $9,000 support could spark a sustained downward move below the $8,800 level in the coming sessions. The next major support is seen near the $8,500 level.
Technical indicators
4 hours MACD – The MACD for BTC/USD is gaining pace in the bullish zone.
4 hours RSI (Relative Strength Index) – The RSI for BTC/USD is currently just above the 50 level.
Major Support Level – $9,000
Major Resistance Level – $9,200
Take advantage of the trading opportunities with Plus500
Risk disclaimer: 76.4% of retail CFD accounts lose money.


