Reason to trust

How Our News is Made
Strict editorial policy that focuses on accuracy, relevance, and impartiality
Ad discliamer
Morbi pretium leo et nisl aliquam mollis. Quisque arcu lorem, ultricies quis pellentesque nec, ullamcorper eu odio.
If you’ve followed Bitcoin analysts over recent weeks, you likely know of the importance of $9,500 to the cryptocurrency.
As the chart below indicates, $9,500 has been a crucial price point for Bitcoin over the past two months. A rally in late-April topped almost exactly at $9,500 while that level has also acted as a pivot point for both buyers and sellers.
Chart of BTC's price action over the past two months from TradingView.com
$9,500 is also the point at which there exists a perfect storm of technical levels. They include but are not limited to:
- June’s volume-weighted average price
- The 200 moving average on the four-hour chart
- The 61.8% Fibonnaci retracement
With this technical backdrop, analysts believe there’s a higher likelihood Bitcoin sustains a rejection at $9,500 than passing it.
An analyst says, though, that the S&P 500 passing 3,200 could change that likelihood in favor of Bitcoin bulls.
For Bitcoin to Retake $9,500, the S&P 500 Needs to Rally
Like Bitcoin, the S&P 500 has also been range-bound over recent weeks. The leading equities index has traded between 3,000 and 3,200 incessantly, failing to establish a trend out of this zone.
Yet, a full-time trader says that the S&P 500 moving above this range will lead to bullish price action in the cryptocurrency market.
“If the S&P 500 sweeps the highs and rejects (3175)-> BTC sweeps the highs and rejects (9350). If the SPX pushes to 3,200+ -> BTC pushes to 9500+. If the SPX moon shots above the highs -> BTC tries to run through 9700.”
The trader’s analysis is predicated on the existence of the correlation that has formed between the two markets.
JP Morgan analysts have argued that since March’s crash, “Cryptocurrencies have traded more like risky assets like equities—a significant change relative to the prior couple of years.” And even one of Bitcoin’s biggest bulls, the pseudonymous analyst “PlanB,” has said BTC might be correlated to the S&P 500.
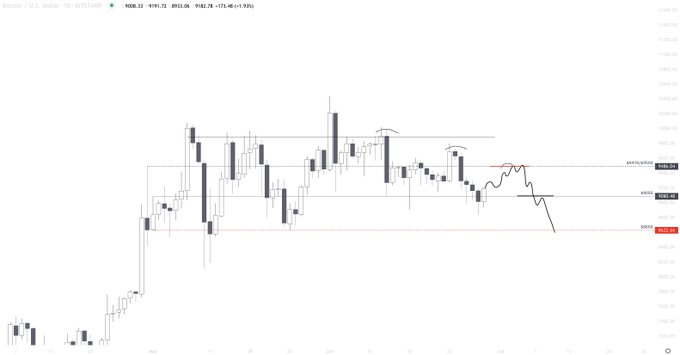
Bitcoin reclaiming $9,500 will indicate a shift from a bearish to bullish bias, an analyst has said.
Referencing the chart below, he wrote:
“This is the current path that PA could be looking to take, buyers defended the initial breakdown in high 8000’s range which is a good start, next level to test is $9250… To flip to a bullish bias $9500 needs to be flipped into support on a daily timeframe.”
Bitcoin price analysis by trader Cactus (@TheCryptoCactus on Twitter). Chart from TradingView.com
Related Reading: Libra Partner Bison Trails Just Announced Support for Ethereum 2.0
Unlikely to Happen
Unfortunately for bulls, there is a growing sentiment that the S&P 500 won’t make it above 3,200 points in the near term.
Mad Money’s Jim Cramer said on Wednesday that the short-term future for stocks may be “ugly.” He referenced a chart from a technical analyst indicating that the S&P 500 is still trapped below resistance levels.
There are also bearish fundamentals, including a worsening pandemic and the dozens of millions unemployed.
With this backdrop, investors such as Jeremy Grantham and Scott Minerd are hard-pressed to see stocks remaining at such high valuations.
Featured Image from Shutterstock
Price tags: xbtusd, btcusd, btcusdt
Charts from TradingView.com
If the S&P 500 Passes 3,200, Then Bitcoin Can Retake $9,500: Analyst


