
Reason to trust
How Our News is Made
Strict editorial policy that focuses on accuracy, relevance, and impartiality
Ad discliamer
Morbi pretium leo et nisl aliquam mollis. Quisque arcu lorem, ultricies quis pellentesque nec, ullamcorper eu odio.
Bitcoin was rejected once again near the $9,300 resistance against the US Dollar. BTC is currently recovering, but it remains at a risk of more downsides below $9,000.
- Bitcoin topped near $9,302 and declined more than $300 in the past few hours.
- The price is now trading well below $9,200 and the 100 hourly simple moving average.
- There was a break below a crucial bullish trend line with support at $9,185 on the hourly chart of the BTC/USD pair (data feed from Kraken).
- The pair is likely to fail again near $9,200 and it could continue to move down below $9,000.
Bitcoin Price Turns Red
After yet another failure near $9,300, bitcoin started a sharp decline against the US Dollar. BTC broke the $9,200 support and the 100 hourly simple moving average to move into a bearish zone.
There was a sharp decline below the $9,100 and $9,080 levels. More importantly, there was a break below a crucial bullish trend line with support at $9,185 on the hourly chart of the BTC/USD pair.
The pair even broke the $9,000 level and traded as low as $8,933. It is currently correcting higher above the $9,000 pivot level. There was a break above the 23.6% Fib retracement level of the recent decline from the $9,302 high to $8,933 low.
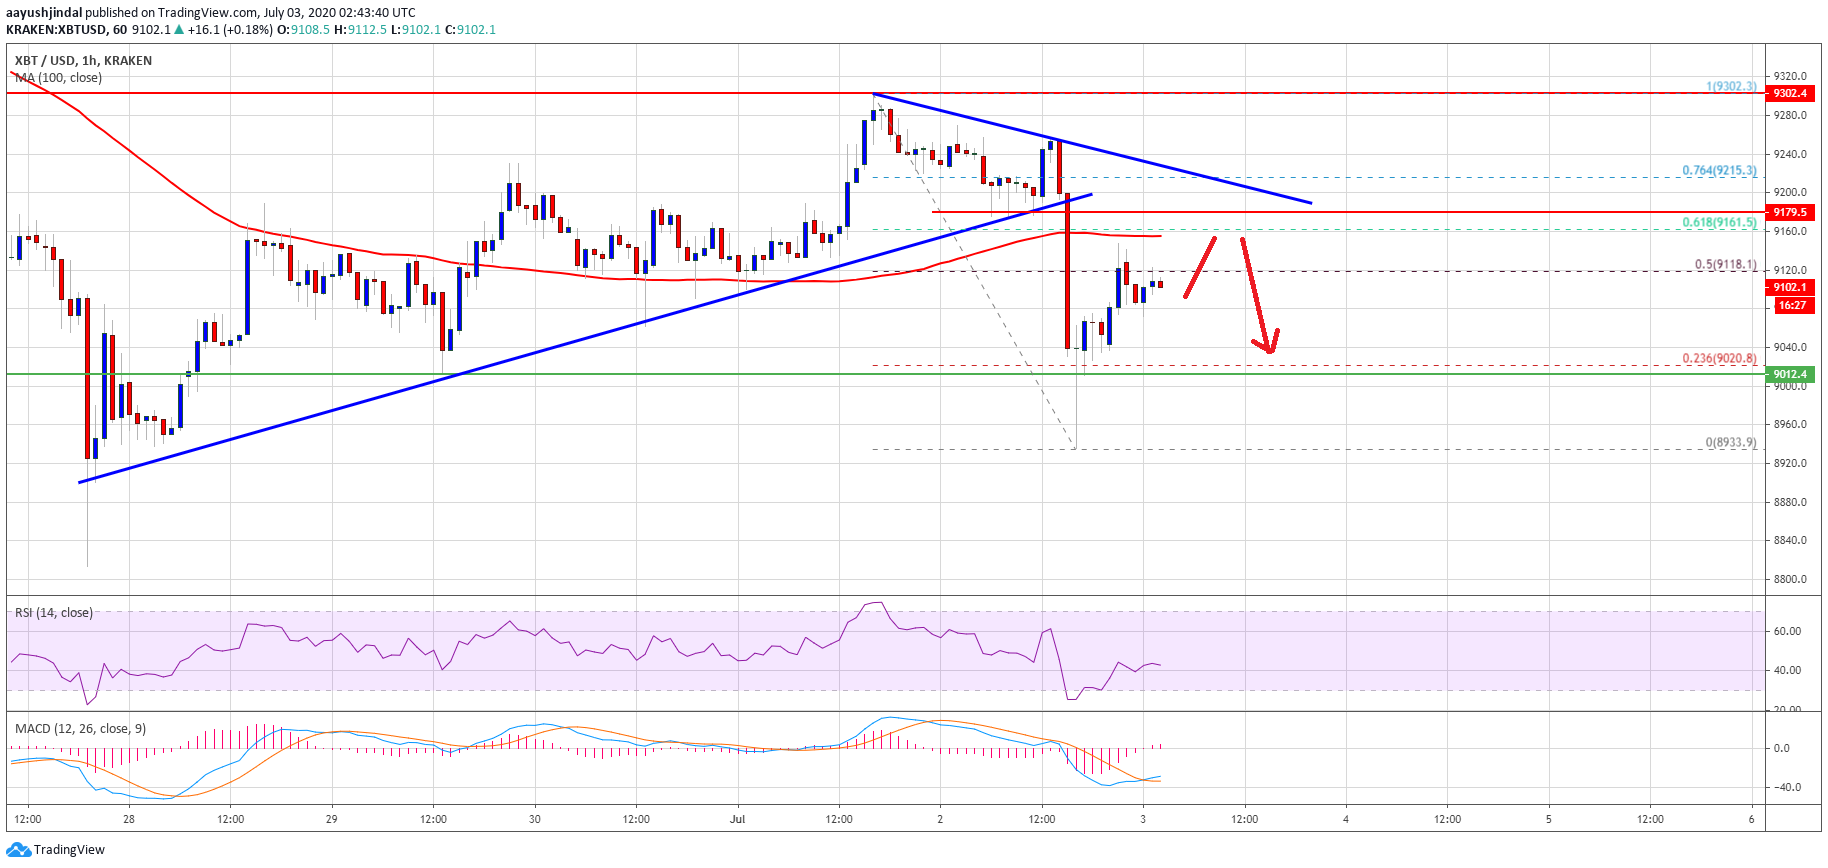
Bitcoin price traded below $9,200: Source: TradingView.com
BTC is currently trading near $9,100 and facing hurdles near the $9,200 level. It seems like the 50% Fib retracement level of the recent decline from the $9,302 high to $8,933 low is acting as a resistance.
The first major resistance is near the $9,160 level and the 100 hourly SMA. The next hurdle is near the $9,200 level and a connecting bearish trend line on the same chart. If there is an upside break above $9,160 and $9,200, the price could revisit the main $9,300 resistance level.
More Losses in BTC?
It seems like bitcoin price is likely to face a strong resistance near $9,160 and $9,200. If it fails to recover above $9,200, there are chances of another bearish wave.
An initial support is near the $9,000 pivot level. A daily close below the $9,000 level could open the doors for a larger decline towards the $8,800 support or $8,500 in the near term.
Technical indicators:
Hourly MACD – The MACD is slowly moving back into the bullish zone.
Hourly RSI (Relative Strength Index) – The RSI for BTC/USD is currently just above the 40 level.
Major Support Levels – $9,000, followed by $8,800.
Major Resistance Levels – $9,160, $9,200 and $9,300.