
Reason to trust
How Our News is Made
Strict editorial policy that focuses on accuracy, relevance, and impartiality
Ad discliamer
Morbi pretium leo et nisl aliquam mollis. Quisque arcu lorem, ultricies quis pellentesque nec, ullamcorper eu odio.
Bitcoin cash price started an upside correction from the $205 support against the US Dollar. BCH is now facing a strong resistance near the $225 and $230 levels.
- Bitcoin cash price is currently correcting higher from the $205 swing low against the US Dollar.
- The price is trading above $220, but the bulls are facing hurdles near $225 and $228.
- There is a crucial bearish trend line forming with resistance near $230 on the 4-hours chart of the BCH/USD pair (data feed from Kraken).
- The pair must clear the $230 resistance zone to start a fresh increase in the near term.
Bitcoin Cash Price Could Reverse Gains
This past week, bitcoin cash price broke the main $225 support level to start a sharp decline. BCH even traded below the $215 support level and settled well below the 100 simple moving average (4-hours).
It tested the $205 support and remained well bid above the $200 handle. As a result, the price started an upside correction above the $215 and $220 levels. It is now trading near a major resistance at $225 (the recent breakdown zone).
The 50% Fib retracement level of the downward move from the $245 swing high to $205 low is also acting as a resistance near $225. More importantly, there is a crucial bearish trend line forming with resistance near $230 on the 4-hours chart of the BCH/USD pair.
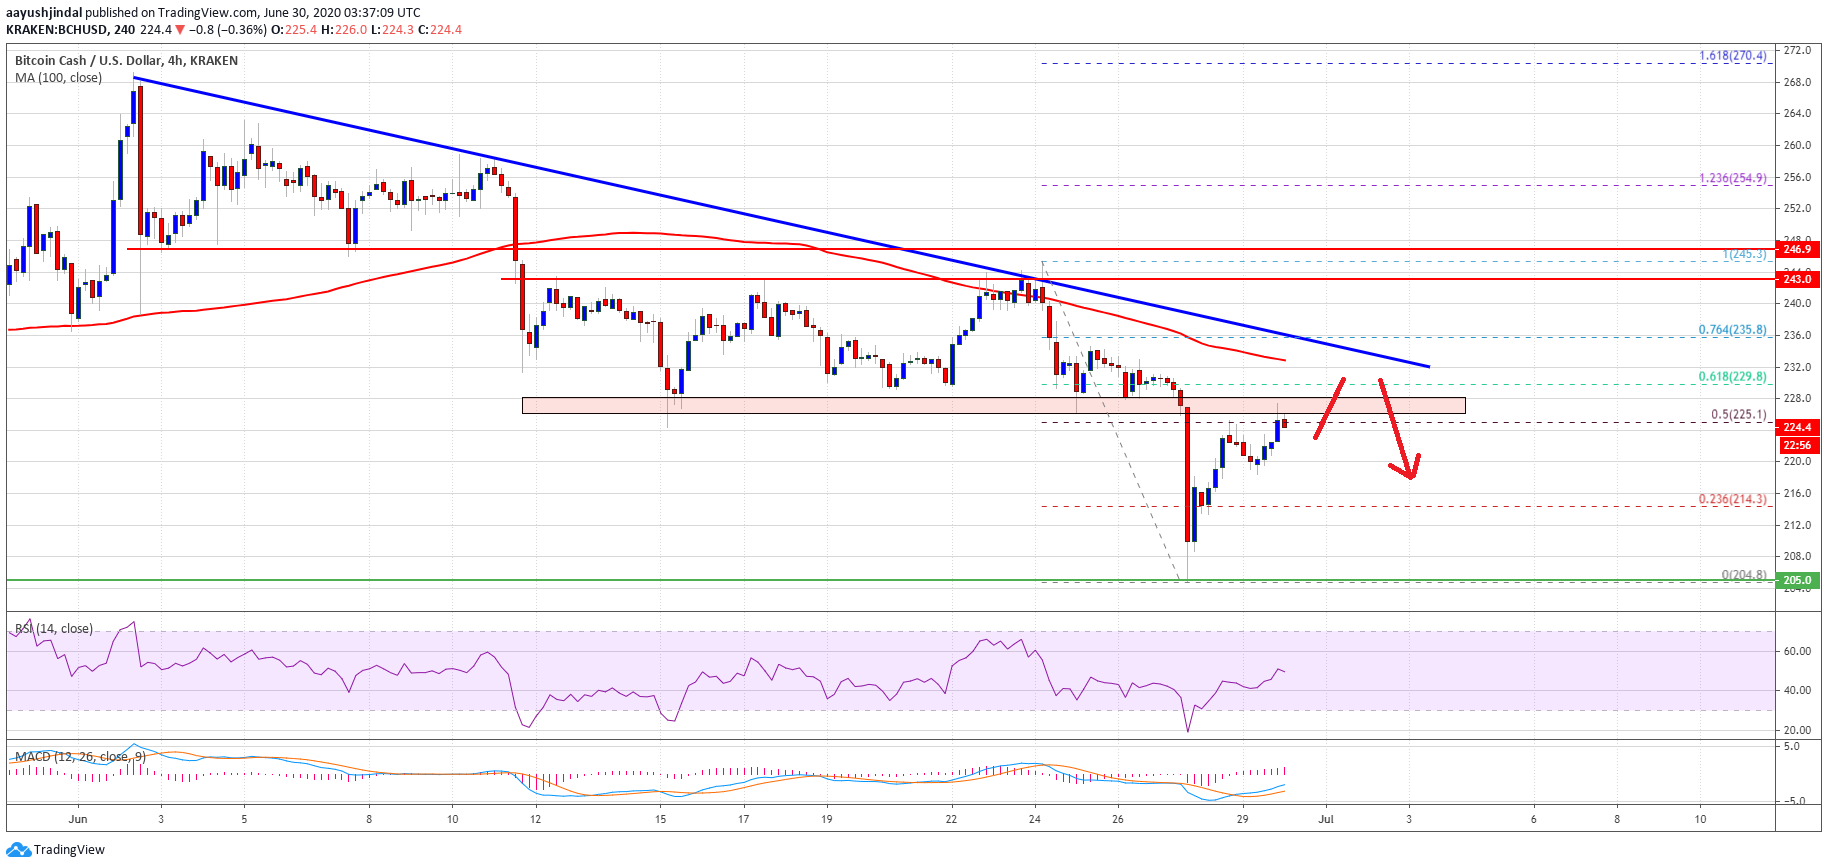
Bitcoin cash price trading near $225: Source: TradingView.com
The trend line is close to the 100 simple moving average (4-hours) and the 61.8% Fib retracement level of the downward move from the $245 swing high to $205 low. Therefore, the bulls need to clear the $225 and $230 resistance levels to start a steady increase.
If they succeed and the price settles above $230, there could be a decent upward move towards the $245 resistance level in the coming sessions.
Fresh Bearish Wave in BCH?
If bitcoin cash price fails to break the trend line hurdle, $230, and the 100 simple moving average (4-hours), there is a risk of a fresh bearish wave.
An initial support is near the $220 level, below which the price could restart its decline. The main support is near the $205 and $200 levels, where the bulls are likely to take a stand.
Technical indicators
Hourly MACD – The MACD for BCH/USD is slowly gaining pace in the bullish zone.
Hourly RSI (Relative Strength Index) – The RSI for BCH/USD is currently close to the 50 level, with a bearish angle.
Key Support Levels – $220 and $205.
Key Resistance Levels – $225 and $230.