
Reason to trust
How Our News is Made
Strict editorial policy that focuses on accuracy, relevance, and impartiality
Ad discliamer
Morbi pretium leo et nisl aliquam mollis. Quisque arcu lorem, ultricies quis pellentesque nec, ullamcorper eu odio.
Ethereum found support near $218 and started a sharp recovery wave against the US Dollar. ETH price is now facing hurdles near the $234 level and the 100 hourly SMA.
- Ethereum is up around 4% and it recovered nicely above $225 and $230.
- The price is currently struggling to gain pace above $234 and the 100 hourly simple moving average.
- There is a short-term ascending channel forming with support near $230 on the hourly chart of ETH/USD (data feed via Kraken).
- The pair is likely to rise further if it clears the $234 and $235 resistance levels.
Ethereum Price Recovers Sharply
Yesterday, there was a downside extension in Ethereum price below the $225 and $220 levels against the US Dollar. ETH traded to a new weekly low at $218 and recently started a strong recovery wave.
There was a break above the $220 and $225 levels. The bulls were able to push the price above the 50% Fib retracement level of the downward move from the $238 swing high to $218 low.
Ether even surpassed a key bearish trend line with resistance near $230 on the hourly chart of ETH/USD. However, the price is currently facing a strong resistance near the $234 level and the 100 hourly simple moving average.
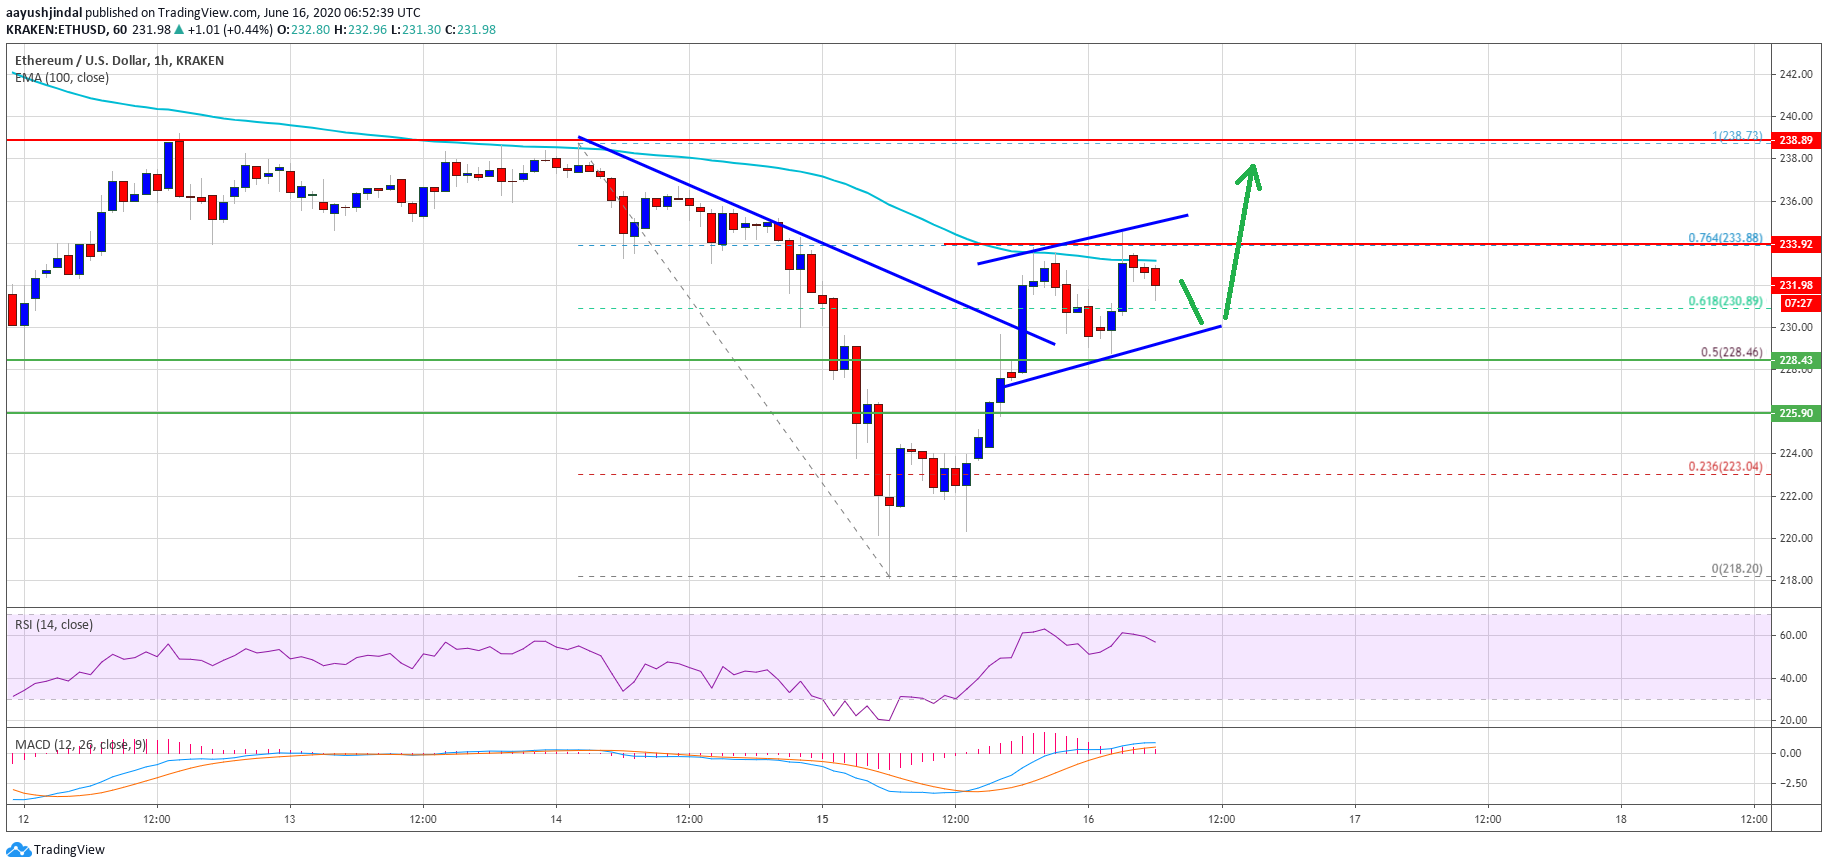
The 76.4% Fib retracement level of the downward move from the $238 swing high to $218 low is also acting as a resistance. If ETH gains pace above the $234 and $235 resistance levels, it is likely to continue higher towards $240 and $245. Any further gains could lead the price towards the main $250 resistance in the near term.
Fresh Decline in ETH?
Ethereum is clearly facing a strong resistance near the $234 level and the 100 hourly SMA. If it fails to continue above the $234 zone, there is a risk of a fresh decline.
It seems like there is a short-term ascending channel forming with support near $230 on the same chart. A downside break below the channel support might increase selling pressure and the price might drop to $220 in the near term.
Technical Indicators
Hourly MACD – The MACD for ETH/USD is slowly losing pace in the bullish zone.
Hourly RSI – The RSI for ETH/USD is now well above the 50 level, with positive signs.
Major Support Level – $225
Major Resistance Level – $234
Take advantage of the trading opportunities with Plus500
Risk disclaimer: 76.4% of retail CFD accounts lose money.