
Reason to trust
How Our News is Made
Strict editorial policy that focuses on accuracy, relevance, and impartiality
Ad discliamer
Morbi pretium leo et nisl aliquam mollis. Quisque arcu lorem, ultricies quis pellentesque nec, ullamcorper eu odio.
Ethereum is following a bearish pattern and it recently failed to surpass $240 against the US Dollar. ETH price is likely to continue lower and it may soon retest the $200 support zone.
- Ethereum failed to clear the main $240 resistance zone and started a fresh decline.
- The price is now trading well below the $230 level and the 100 hourly simple moving average.
- There is a key bearish trend line forming with resistance near $230 on the hourly chart of ETH/USD (data feed via Kraken).
- The pair remains at a risk of more losses towards the $205 and $200 support levels.
Ethereum Price Gaining Bearish Momentum
In the weekly analysis, we discussed the importance of the $240 resistance for Ethereum price against the US Dollar. ETH made a few attempts to clear the $240 resistance, but it failed to continue higher.
As a result, there was a sharp decline below the $230 support and the price settled below the 100 hourly simple moving average. The decline was such that the price broke the $225 swing low and traded to a new weekly low at $218.
It is currently consolidating losses near the $220 level. An initial resistance is near the $224 level. It is close to the 23.6% Fib retracement level of the recent drop from the $240 swing high to $218 low.
The first key resistance for ether price is near the $230 level. There is also a key bearish trend line forming with resistance near $230 on the hourly chart of ETH/USD. The trend line is close to the 50% Fib retracement level of the recent drop from the $240 swing high to $218 low.
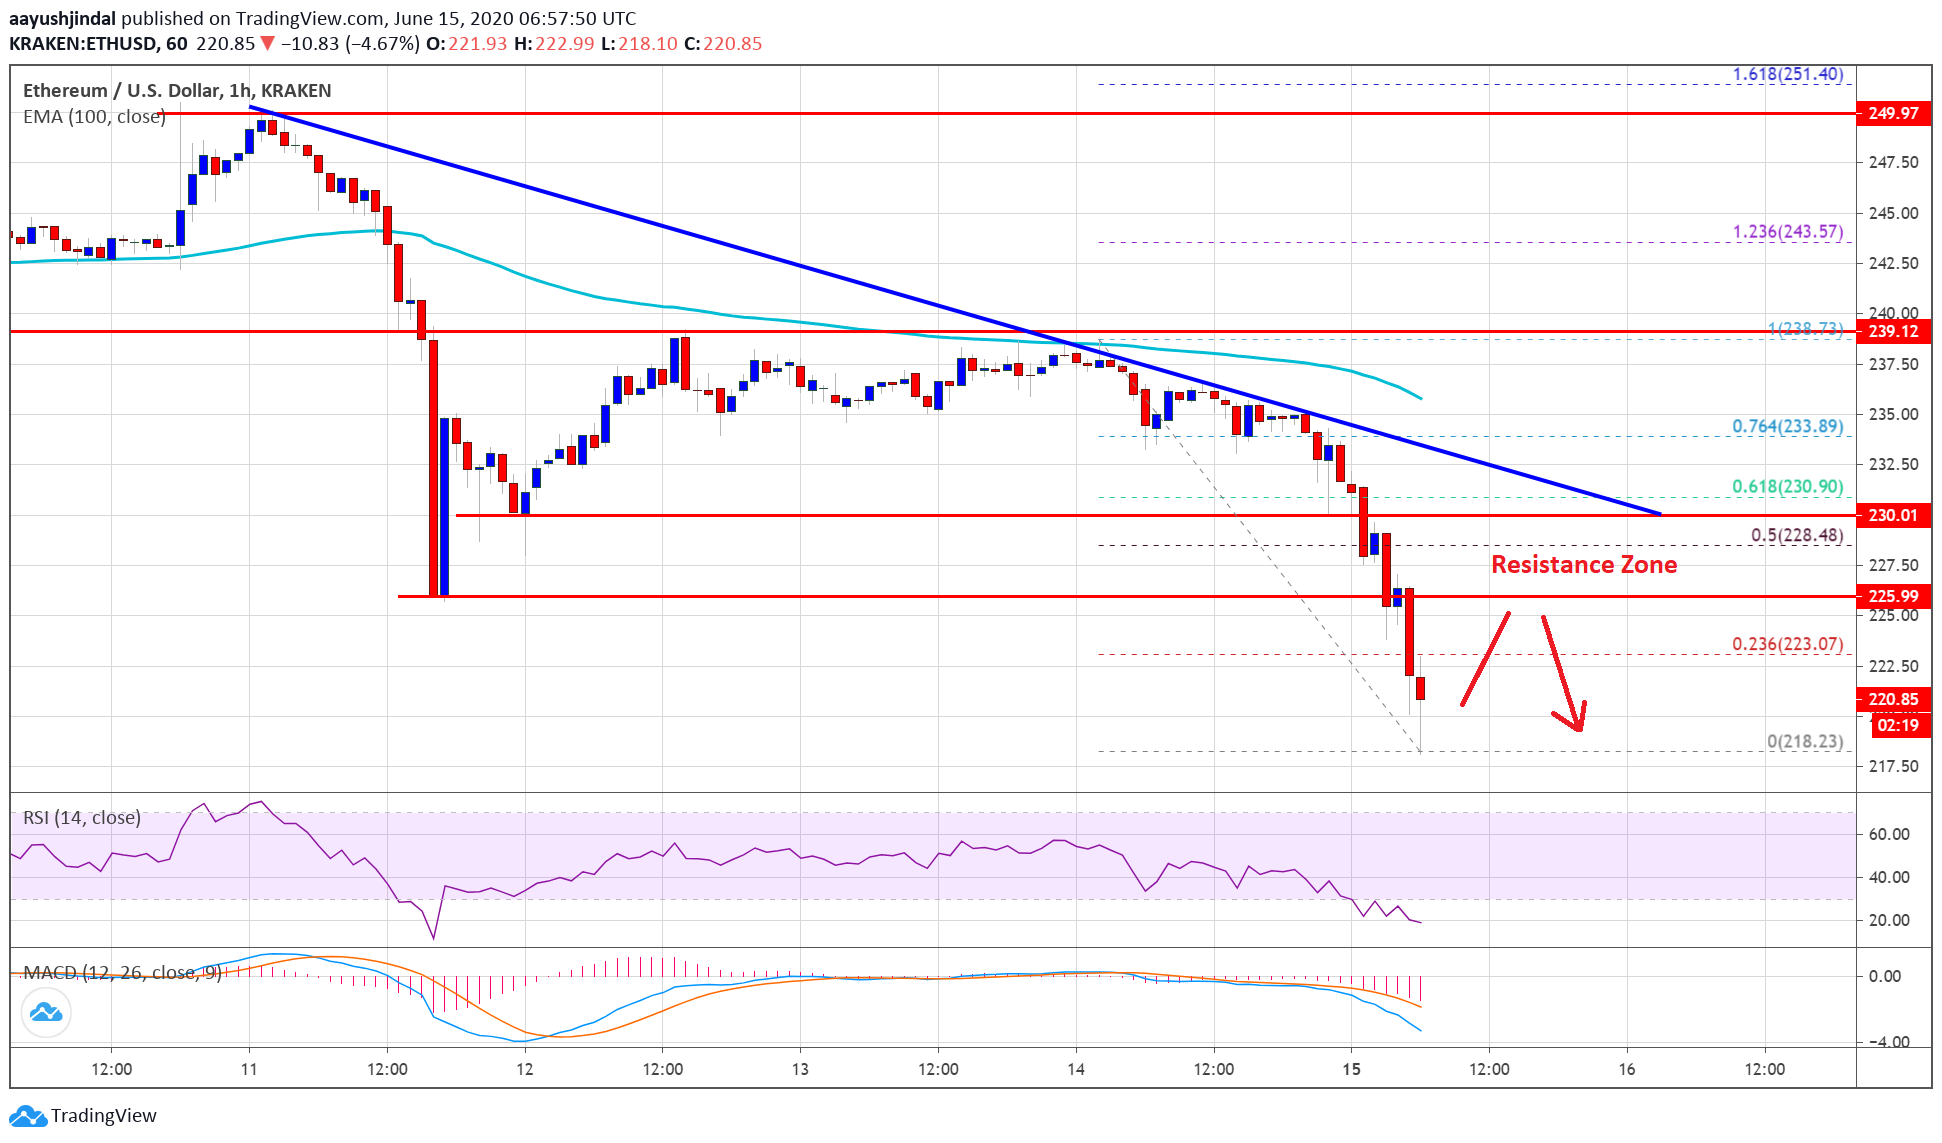
On the downside, the recent low near the $218 level is a short-term support. A clear break below the $218 level might open the doors for more losses below the $215 level. The next major support is seen near the $205 and $200 levels.
Chances of Recovery in ETH?
Ethereum is clearly facing many hurdles near the $228 and $230 level. The first major resistance is near the $235 level and the 100 hourly SMA.
The main resistance is still near the $240 level, above which the price might start a decent upward move in the near term.
Technical Indicators
Hourly MACD – The MACD for ETH/USD is slowly gaining pace in the bearish zone.
Hourly RSI – The RSI for ETH/USD is now well below the 30 level, with oversold conditions.
Major Support Level – $215
Major Resistance Level – $230
Take advantage of the trading opportunities with Plus500
Risk disclaimer: 76.4% of retail CFD accounts lose money.