
Reason to trust
How Our News is Made
Strict editorial policy that focuses on accuracy, relevance, and impartiality
Ad discliamer
Morbi pretium leo et nisl aliquam mollis. Quisque arcu lorem, ultricies quis pellentesque nec, ullamcorper eu odio.
Bitcoin is down more than 5% and it broke the key $9,300 support zone against the US Dollar. BTC traded as low as $9,089 and it is currently correcting higher towards hurdles.
- Bitcoin declined sharply after it was rejected one more time near the $10,000 level.
- There was a break below many key supports near $9,500 and $9,300.
- There is a short term contracting triangle forming with resistance near $9,340 on the hourly chart of the BTC/USD pair (data feed from Kraken).
- The pair could correct further, but upsides are likely to face sellers near $9,400 and $9,500.
Bitcoin Price Turns Red
After another crucial rejection near the $10,000 level, bitcoin price started a major bearish wave against the US Dollar. BTC gained bearish momentum below the $9,800 and $9,500 support levels.
It weakened more than 5% to settle below the $9,500 level and the 100 hourly simple moving average. The decline was such that the price even broke the $9,300 support and traded to a new weekly low at $9,089.
Bitcoin is currently correcting higher and trading above the $9,250 level. It surpassed the 23.6% Fib retracement level of the recent decline from the $9,988 high to $9,089 low. It seems like there is a short term contracting triangle forming with resistance near $9,340 on the hourly chart of the BTC/USD pair.
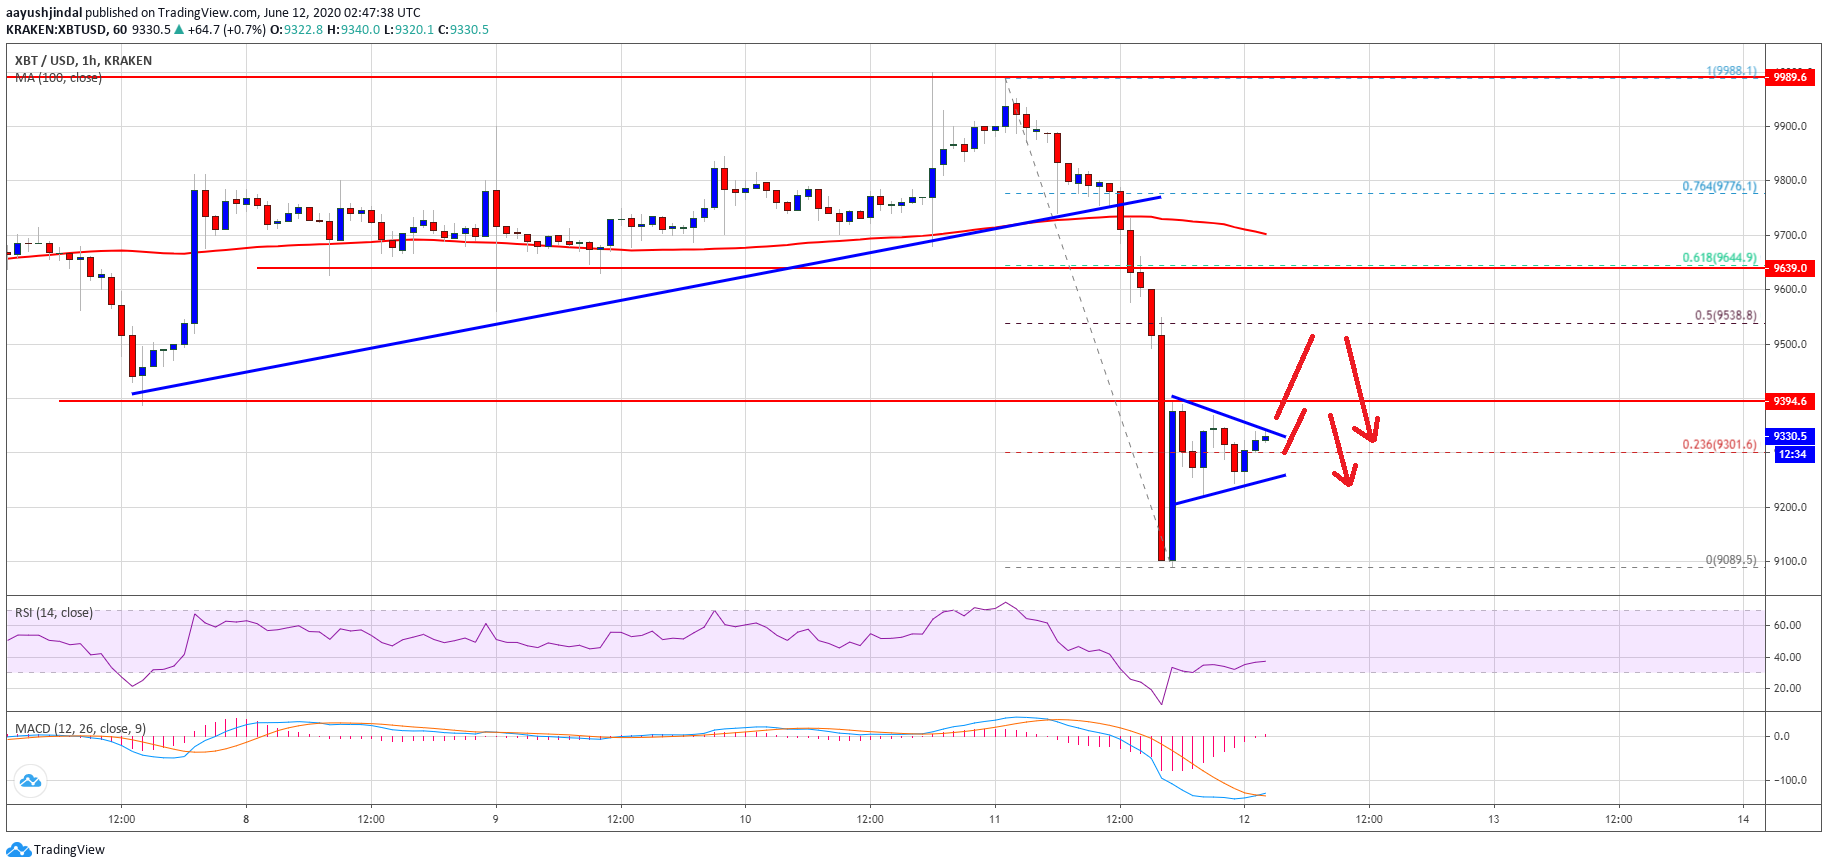
The pair could correct further above the triangle resistance and $9,350. However, the pair is likely to face a lot of hurdles near the $9,400 and $9,500 levels (the previous key supports).
The next key resistance could be near the $9,540 level or the 50% Fib retracement level of the recent decline from the $9,988 high to $9,089 low. Any further gains could decrease the bearish pressure and the price might recover towards the $9,800 resistance.
More Losses in BTC?
Once bitcoin price completes the current correction wave near $9,400 or $9,500, it is likely to resume its decline. An initial support on the downside is near the $9,300 level.
The next major support is near the $9,100 level, below which there is a risk of more losses below the $9,000 handle in the coming sessions. In the stated case, the price could revisit $8,800.
Technical indicators:
Hourly MACD – The MACD is slowly reducing its bearish slope and it could move into the bullish zone.
Hourly RSI (Relative Strength Index) – The RSI for BTC/USD is currently recovering higher towards 40.
Major Support Levels – $9,300 followed by $9,100.
Major Resistance Levels – $9,400, $9,500 and $9,540.