
Reason to trust
How Our News is Made
Strict editorial policy that focuses on accuracy, relevance, and impartiality
Ad discliamer
Morbi pretium leo et nisl aliquam mollis. Quisque arcu lorem, ultricies quis pellentesque nec, ullamcorper eu odio.
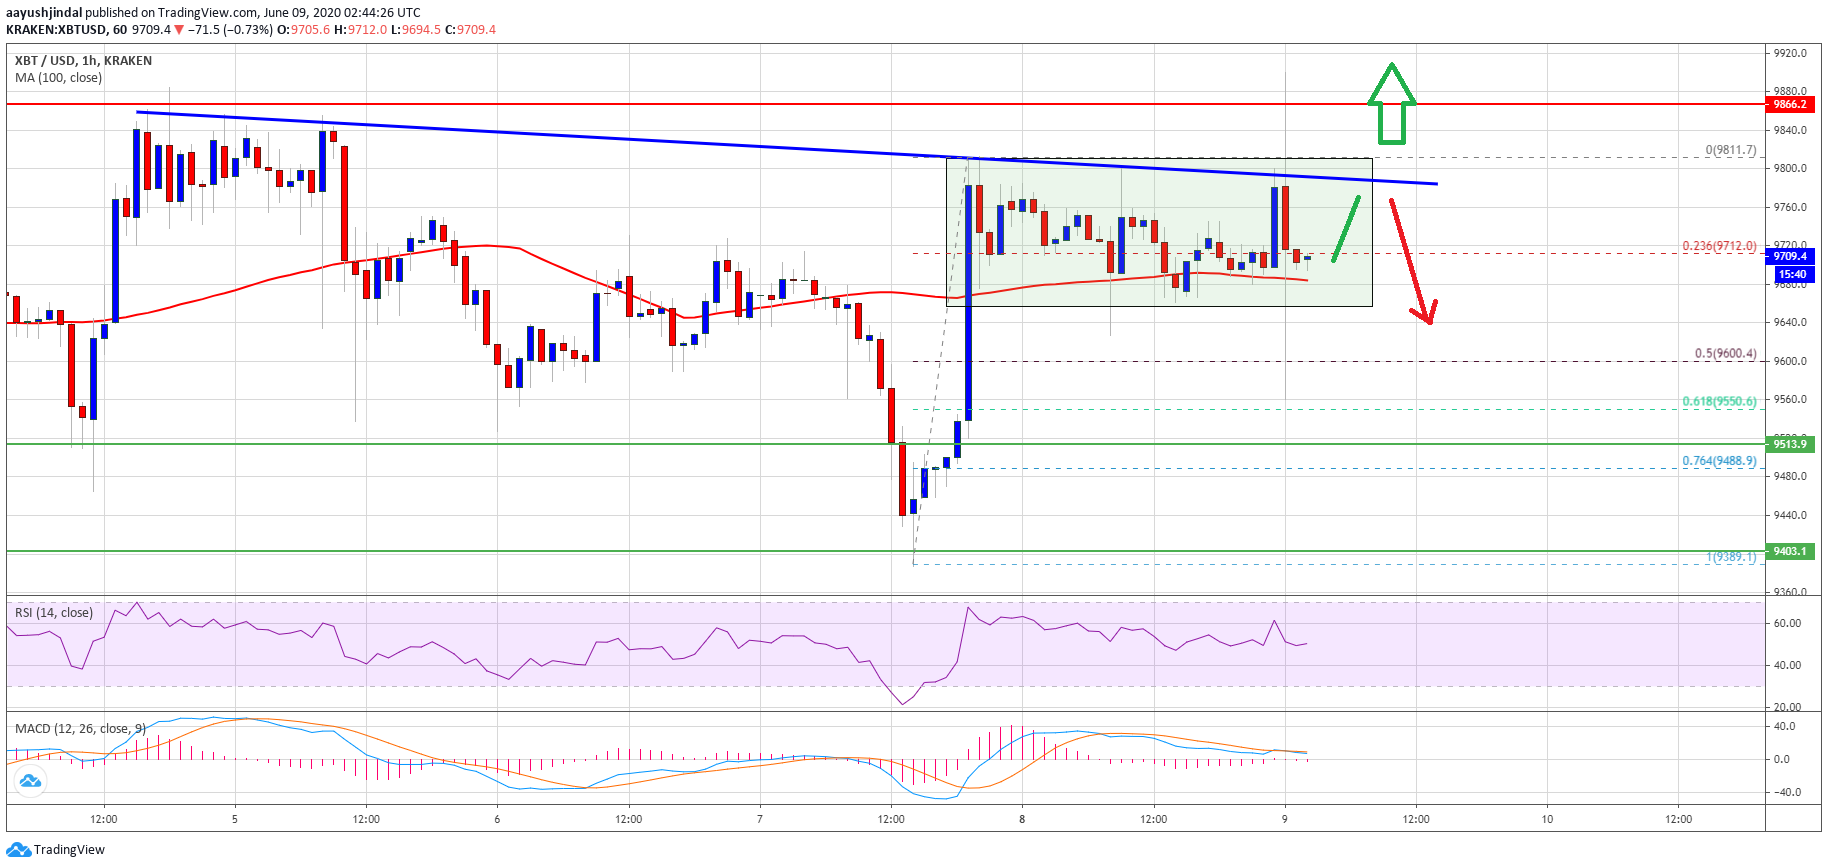
Bitcoin is trading in a tight range above the $9,640 support against the US Dollar. BTC price is likely to surge higher if it clears the $9,800 and $9,880 range resistance levels.
- Bitcoin is trading in a positive zone above the $9,640 and $9,600 support levels.
- The bulls are likely aiming an upside break above the $9,880 resistance zone.
- There is a key bearish trend line forming with resistance near $9,800 on the hourly chart of the BTC/USD pair (data feed from Kraken).
- A downside break below the 100 hourly SMA could start a major decline to $9,500 or $9,300.
Bitcoin Price Stuck In A Range
After a strong recovery wave, bitcoin price faced a strong resistance near the $9,880 level against the US Dollar. BTC started trading in a range below the $9,880 level and it seems to be preparing for the next major move.
There was a break below the $9,720 level, plus the 23.6% Fib retracement level of the upward move from the $9,389 low to $9,811 high. However, the $9,640 level and the 100 hourly simple moving average are acting as strong supports.
On the upside, there is a major hurdle forming near the $9,800 and $9,880 levels. There is also a key bearish trend line forming with resistance near $9,800 on the hourly chart of the BTC/USD pair.
If bitcoin clears the trend line resistance, there are chances of a sharp rally above the $9,880 resistance. The next major resistance is near the $10,000 level, above which the bulls are likely to aim a test of the $10,500 resistance zone in the near term. Any further gains could lead the price towards the $11,200 barrier.
Bearish Move in BTC?
On the downside, there is a range support forming near the $9,640 level and the 100 hourly simple moving average. If there is a bearish break below the 100 hourly SMA, the price could test the $9,600 level.
The 50% Fib retracement level of the upward move from the $9,389 low to $9,811 high is near the $9,600 level to act as a support. Any further losses may perhaps put a lot of pressure on the bulls and the price might decline further towards the $9,500 support or $9,400.
Technical indicators:
Hourly MACD – The MACD is likely to gain strength in the bullish zone.
Hourly RSI (Relative Strength Index) – The RSI for BTC/USD is currently struggling to stay above the 50 level.
Major Support Levels – $9,640 followed by $9,500.
Major Resistance Levels – $9,800, $9,880 and $10,000.