
Reason to trust
How Our News is Made
Strict editorial policy that focuses on accuracy, relevance, and impartiality
Ad discliamer
Morbi pretium leo et nisl aliquam mollis. Quisque arcu lorem, ultricies quis pellentesque nec, ullamcorper eu odio.
Bitcoin is surging and it recently tested the $9,400 support area against the US Dollar. BTC price is likely to continue higher towards $10,000 as long as it is above the 100 hourly SMA.
- Bitcoin is showing positive signs above the $9,650 and $9,700 levels.
- There was a sharp rebound after the price declined towards the $9,400 support zone
- There was a break above a key bearish trend line with resistance near $9,670 on the hourly chart of the BTC/USD pair (data feed from Kraken).
- The pair is likely to accelerate higher towards $10,000 as long as it is above the 100 hourly SMA.
Bitcoin Price Could Continue Higher
In the past two sessions, there were swing moves in bitcoin price below $9,800 against the US Dollar. BTC declined sharply below the $9,600 and $9,500 levels, but the $9,400 region acted as a strong support.
A low was formed near $9,393 and the price recently recovered sharply. It broke the $9,500 and $9,600 resistance levels. There was a break above the 50% Fib retracement level of the recent decline from the $9,892 high to $9,393 low.
More importantly, there was a break above a key bearish trend line with resistance near $9,670 on the hourly chart of the BTC/USD pair. The pair is now trading nicely above the $9,700 level and the 100 hourly simple moving average.
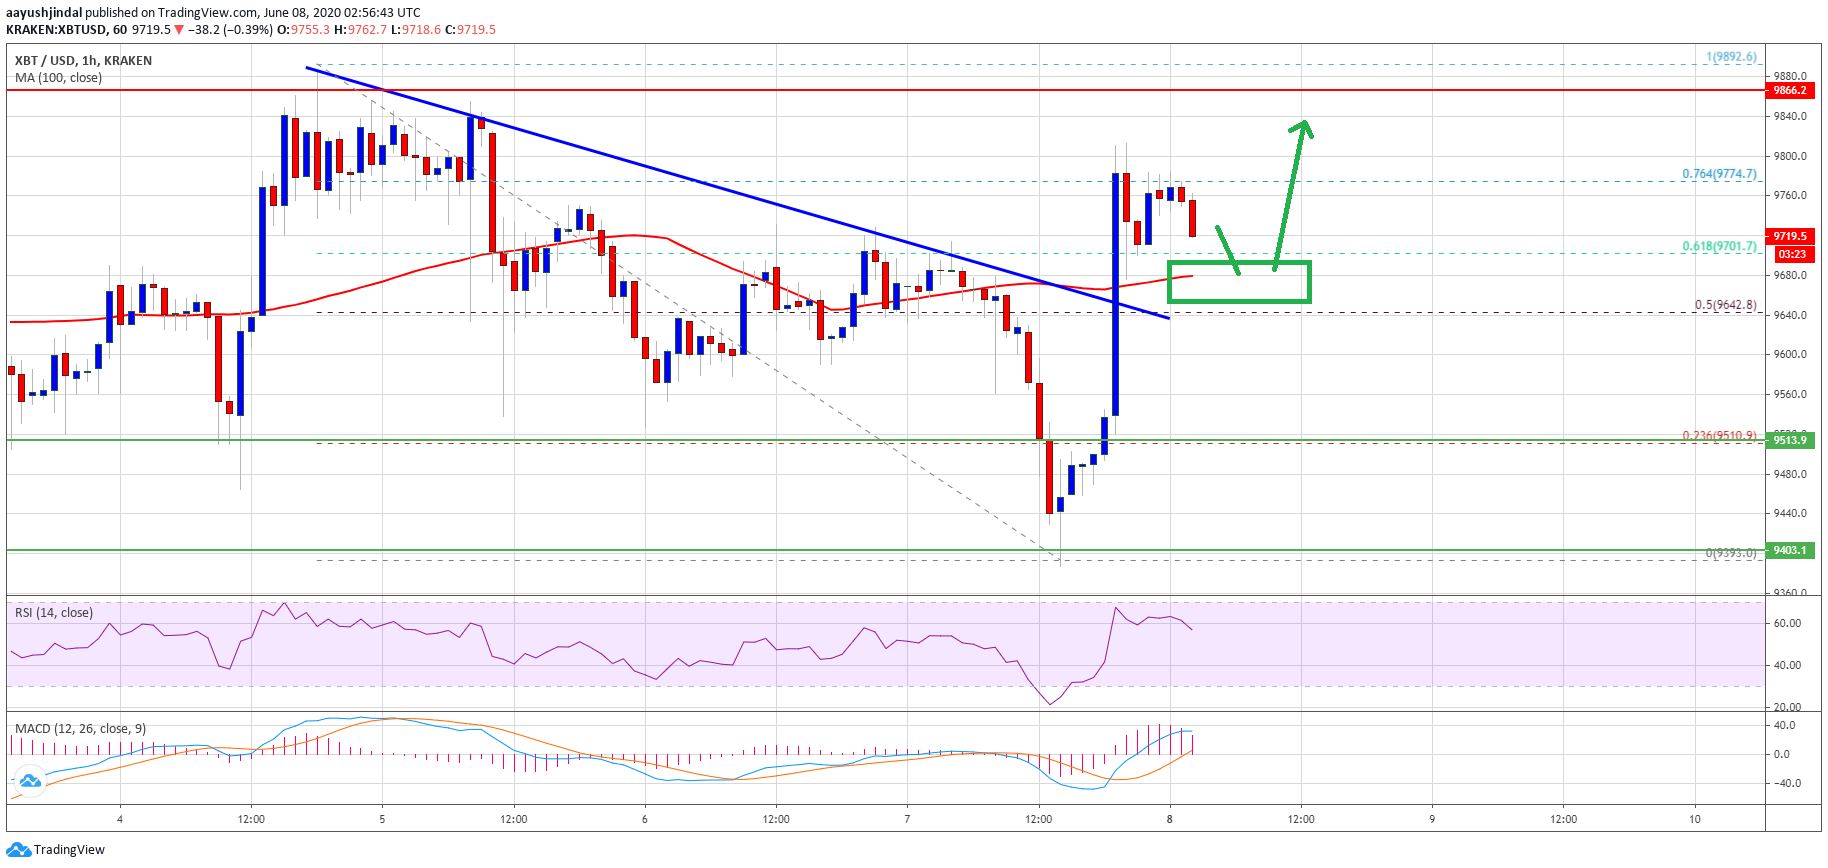
On the upside, an initial resistance is near the $9,800 level or the 76.4% Fib retracement level of the recent decline from the $9,892 high to $9,393 low. If there is a clear break above the $9,800 resistance, the price is likely to continue higher towards the $9,880 and $10,000 resistance levels.
Any further gains above the $10,000 resistance zone could open the doors for a fresh monthly high above $10,400 in the coming sessions.
Dips Likely Supported in BTC
On the downside, there is a key support forming near the $9,680 level and the 100 hourly simple moving average. If the price fails to stay above the 100 hourly SMA, it could continue to slide towards the $9,500 support.
The main support zone is near the $9,400 and $9,300 levels, below which the bears are likely to take control and the price could decline sharply.
Technical indicators:
Hourly MACD – The MACD is currently moving nicely in the bullish zone.
Hourly RSI (Relative Strength Index) – The RSI for BTC/USD is now correcting lower from the 65 level.
Major Support Levels – $9,680 followed by $9,500.
Major Resistance Levels – $9,800, $9,880 and $10,000.


