
Reason to trust
How Our News is Made
Strict editorial policy that focuses on accuracy, relevance, and impartiality
Ad discliamer
Morbi pretium leo et nisl aliquam mollis. Quisque arcu lorem, ultricies quis pellentesque nec, ullamcorper eu odio.
Ripple failed to continue higher above $0.2150 and declined sharply against the US Dollar. XRP is showing bearish signs just like bitcoin and it could dive further below $0.2000.
- Ripple traded as high as $0.2146 and recently started a sharp decline against the US dollar.
- The price is now trading well below $0.2050 and remains at a risk of more losses.
- There was a break below a key bullish trend line with support near $0.2060 on the hourly chart of the XRP/USD pair (data source from Kraken).
- The pair is likely to continue lower if it breaks the $0.2000 and $0.1950 support levels.
Ripple Price Turns Red
After a steady rise, ripple price faced a strong selling interest near the $0.2150 resistance. The key driving force was bitcoin, declining more than 6% below the $10,000 and $9,500 levels.
XRP price followed a bearish path from the $0.2146 high and it declined sharply below $0.2100. There was a break below the $0.2050 support and the 100 hourly simple moving average.
Moreover, there was a break below a key bullish trend line with support near $0.2060 on the hourly chart of the XRP/USD pair. The pair traded as low as $0.1977 and it is currently correcting higher. It recovered above the $0.2000 level.
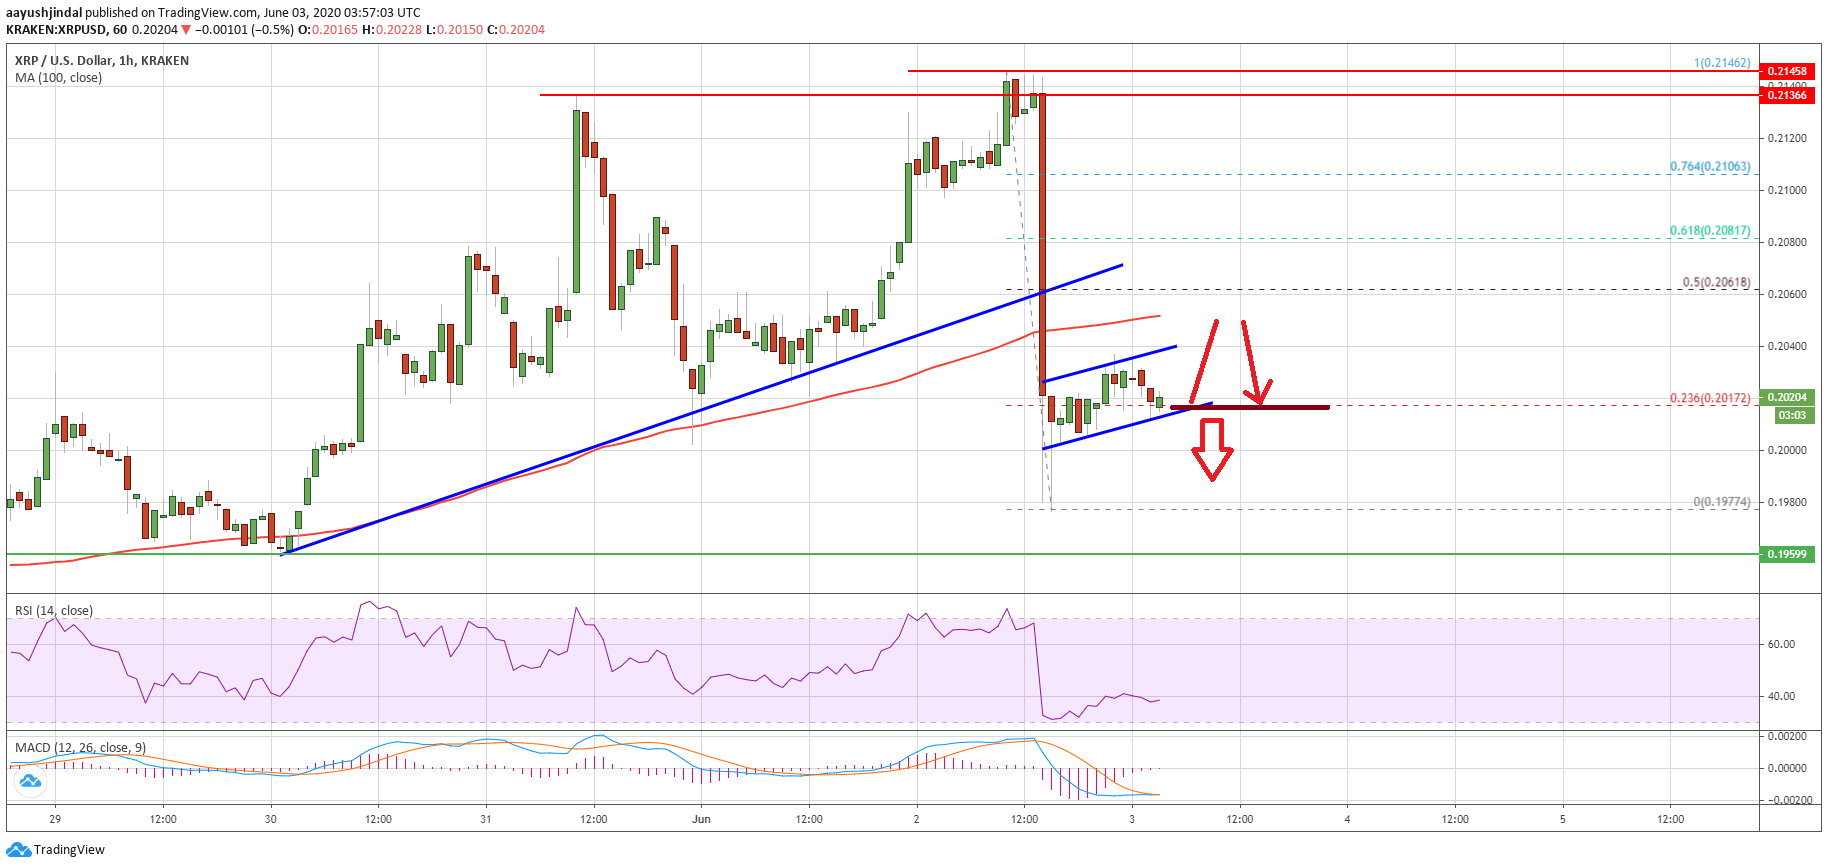
Ripple managed to climb above the 23.6% Fib retracement level of the recent decline from the $0.2146 high to $0.1977 low. However, the price struggled to continue above $0.2050. It is currently following a short term ascending channel with support near $0.2010.
If the price fails to stay above the $0.2000 support zone, it is likely to resume its decline. The first major support is near the $0.1950 level, below which it could revisit the main $0.1920 support. Any further losses may perhaps start a significant decline towards the $0.1800 level in the near term.
Recovery in XRP?
On the upside, an initial resistance is near the $0.2050 level and the 100 hourly simple moving average. The next major resistance is near the $0.2060 level or the 50% Fib retracement level of the recent decline from the $0.2146 high to $0.1977 low.
To start a fresh increase, the price must surpass the $0.2060 and $0.2065 resistance levels. Any further gains could lead the price towards the $0.2100 zone in the coming sessions.
Technical Indicators
Hourly MACD – The MACD for XRP/USD is slowly moving into the bullish zone.
Hourly RSI (Relative Strength Index) – The RSI for XRP/USD is currently well below the 40 level.
Major Support Levels – $0.2000, $0.1950 and $0.1920.
Major Resistance Levels – $0.2050, $0.2060 and $0.2100.
Take advantage of the trading opportunities with Plus500
Risk disclaimer: 76.4% of retail CFD accounts lose money.