Reason to trust

How Our News is Made
Strict editorial policy that focuses on accuracy, relevance, and impartiality
Ad discliamer
Morbi pretium leo et nisl aliquam mollis. Quisque arcu lorem, ultricies quis pellentesque nec, ullamcorper eu odio.
The altcoin market continues to vastly underperform against Bitcoin, however, the candle close last night on monthly and weekly timeframes hints at widespread investor confusion over what happens next across the crypto asset class.
Indecision Evident On Total Altcoin Market Trading Against Bitcoin
Over the weekend, altcoins showed strong performance against Bitcoin. Ethereum closed the daily recently with an over 10% return, while Bitcoin fell far behind.
However, altcoins like Ethereum and countless others are still so far behind Bitcoin. Altcoins that fell just as hard as Bitcoin from all-time high prices have recovered nowhere nearly as much.
Altcoins haven’t even recovered as well as Bitcoin from the highs set prior to the Black Thursday market collapse.
Related Reading | Ethereum Chart Makes It Clear: Altcoin Season Is Already Over
All throughout 2020, there have been signs and glimmers that an altcoin season may be underway, but each new volatile move in Bitcoin keeps them treading water.
Even over the weekend, the altcoin rally was cut short when Bitcoin blasted back to $9700 momentarily before it was rejected back to prices below.
Continued altcoin underperformance has crypto investors fearing that former highs will never return. But prices have also failed to set new lows.
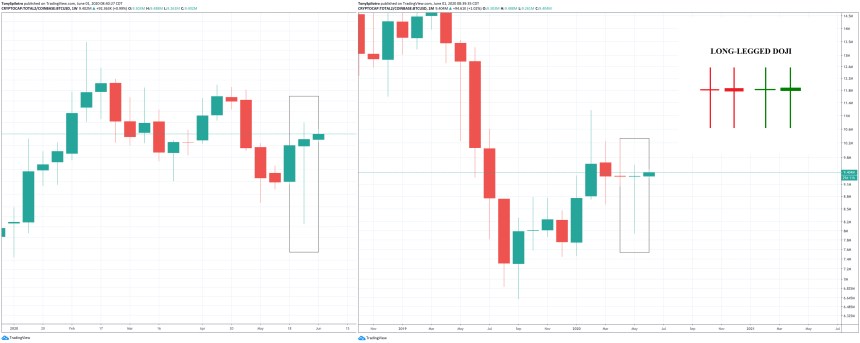
What’s left behind, are indecision candles on multiple timeframes via a pair of long-legged doji.

Decision Time: Crypto Trend Change May Be Here, According to Long-Legged Doji
On the Altcoin/BTC trading pair on TradingView, last night’s weekly and monthly close, both left behind a long-legged doji candle.
According to the study of Japanese candlesticks, this type of doji “signals indecision about the future direction of the underlying security.” Long-legged doji form when the price of an asset opens and closes at roughly the same level. Yet unlike regular doji candles, the wicks are notably long.
These candlestick patterns can warn traders that a trend change is coming after a strong advance or decline. Investopedia says that long-legged doji “are deemed to be most significant when they occur during a strong uptrend or downtrend.”
“The long-legged doji suggests that the forces of supply and demand are nearing equilibrium and that a trend reversal may occur,” the website explains.
Japanese candlesticks are given more weight when they appear on higher timeframes, such as monthly or weekly price charts. In this unique case both the weekly and monthly price charts on the Altcoin/BTC trading pair depict this indecision candle.
The Altcoin/BTC trading pair takes the total altcoin market cap sans Bitcoin and weighs it against BTC in an inverse dominance chart.
Related Reading | Major Crypto Assets Are Preparing For Powerful Volatility Against Bitcoin
Because this includes all other altcoins against Bitcoin, it isn’t clear which altcoins, if any, may experience a reversal against the number one cryptocurrency by market cap. That is if a reversal happens at all.
An explosive move in altcoins against Bitcoin is expected in one direction or the other, as these assets are showing the tightest Bollinger Band Widths in recent history. This behavior often proceeds an explosive break in volatility, so a decision could be made in the coming month or week ahead.


