Reason to trust

How Our News is Made
Strict editorial policy that focuses on accuracy, relevance, and impartiality
Ad discliamer
Morbi pretium leo et nisl aliquam mollis. Quisque arcu lorem, ultricies quis pellentesque nec, ullamcorper eu odio.
Because Bitcoin is an asset unlike anything else before it, analysts use a set of unorthodox, uniquely developed tools for fundamental analysis.
One of these tools praised as “one of the greatest ever” indicators, is currently “screaming buy.” The only previous three times this indicator gave buy signals, it resulted in an average of over 5,000% return on investment.
Cryptocurrency Fundamental Analysis Tools Focus on Network Health, BTC Miners
Bitcoin is the first-ever cryptocurrency and the first digital asset to solve double-spending through a proof-of-work system called mining.
These miners are so important to the underlying network’s health and can have such significant influence on price action, that dozens of indicators have been developed by top Bitcoin researchers to help them make sense of the asset’s long-term valuation potential.
Rather than speculate like most that Bitcoin will reach incredible prices of $100,000 to over $1 million per BTC, these tools look at fundamentals that could influence the asset’s longevity as a technology, store of wealth, and more.
Related Reading | Bitcoin Hash Ribbons Indicate Post-Halving Miner Capitulation Has Begun
Many of these tools are giving conflicting signals. An indicator called the Hash Ribbons looks at Bitcoin miner hash rate – which recently set a new 2020 low – to understand if miners will be selling their BTC holdings or not.
That indicator appears to suggest that miners are capitulating due to the sudden, overnight increase in the cost of production that the halving brought forth.
Each halving reduces the block reward these miners receive for securing the Bitcoin protocol and add each block of transactions to its immutable digital ledger on the blockchain.
Puell Multiple is a screaming buy. One of the greatest ever. You do not want to be selling here folks.
Save yourselves and stack.@PositiveCrypto @kenoshaking #bitcoin pic.twitter.com/WfrWLR50yf
— Riggs (@RiggsBTC) May 27, 2020
Greatest Bitcoin Indicator Signals Buy, Averages 5,000% ROI After Triggering
Another indicator that pays close attention to the fundamental health of the leading cryptocurrency by market cap, is the Puell Multiple.
This tool looks at miners and their revenue driven from producing each BTC in combination with related energy expenses.
It is calculated by taking the daily issuance of new Bitcoin in USD value and dividing it by a 365-day moving average of said daily issuance value.
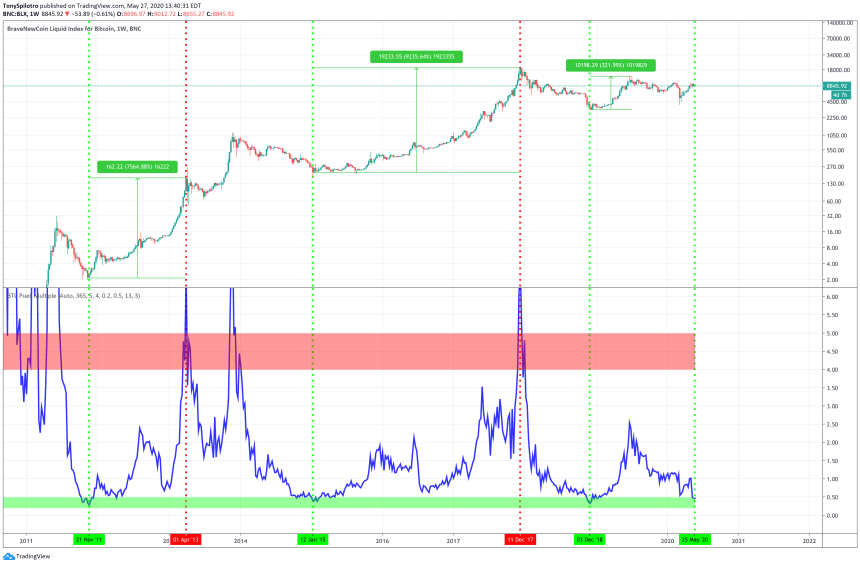
Each time this indicator – considered one of the “greatest ever” – has dropped into the buy zone, it has resulted in an average upside of 5,000%.
Related Reading | Long Term BTC Indicator To Flip Bearish Ahead Of Next Manic Phase
The indicator has only given three signals prior, making this latest dip into the buy zone the fourth in Bitcoin history.
The first dip resulted in an over 7,500% return. The second, coinciding with the 2014-2015 bear market bottom, provided investors with over 9,000% returns.
The signal triggered once again when the cryptocurrency hit its current bear market “bottom” at $3,200, but resulted in the smallest rise following at just over 300%.
Now, the indicator is “screaming buy” once again. How far will Bitcoin climb this time around?


