
Reason to trust
How Our News is Made
Strict editorial policy that focuses on accuracy, relevance, and impartiality
Ad discliamer
Morbi pretium leo et nisl aliquam mollis. Quisque arcu lorem, ultricies quis pellentesque nec, ullamcorper eu odio.
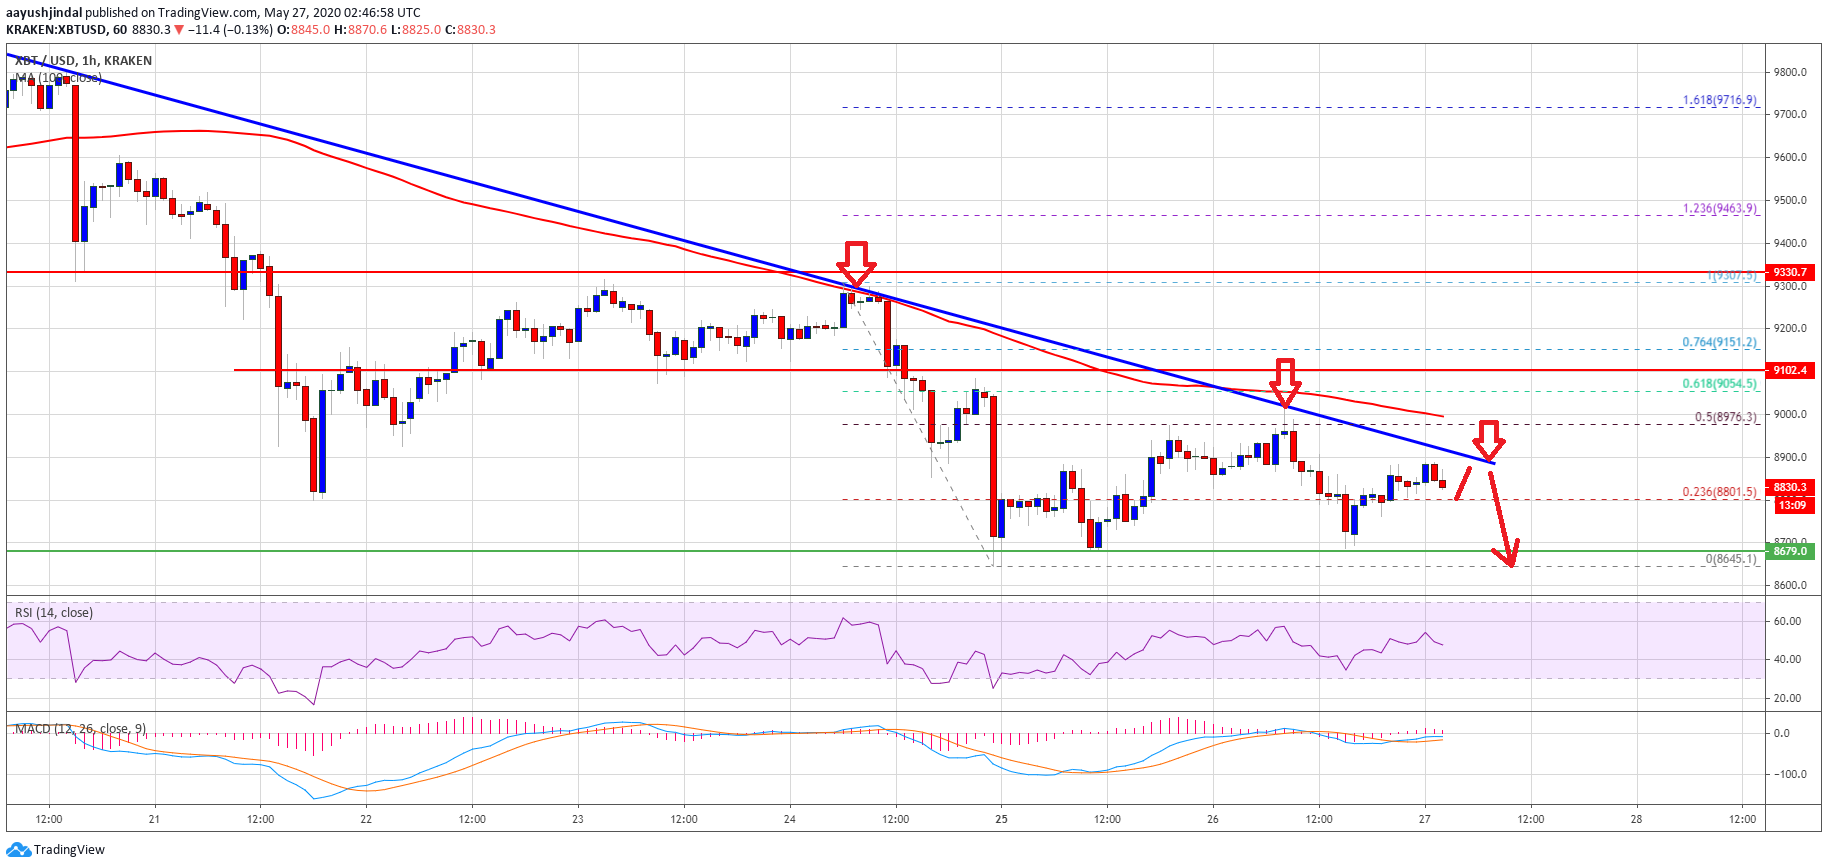
Bitcoin is trading in a bearish zone below $9,000 against the US Dollar. BTC price is likely to accelerate lower if it breaks the $8,680 and $8,600 support levels.
- Bitcoin is declining and trading well below the key $9,100 pivot level.
- The price is likely to continue lower towards the $8,400 and $8,200 support levels.
- There is a major bearish trend line forming with resistance near $8,910 on the hourly chart of the BTC/USD pair (data feed from Kraken).
- The pair could only avoid losses if it gains bullish momentum above $9,000 and $9,100.
Bitcoin Turns Red
Bitcoin price remained well bid above the $8,680 support and recently corrected higher against the US Dollar. BTC price climbed above the $8,800 resistance level, but it stayed well below the 100 hourly simple moving average.
The upward move was capped by the $9,000 resistance zone. It seems like the price failed to surpass the 50% Fib retracement level of the key decline from the $9,305 swing high to $8,645 swing low.
More importantly, there is a major bearish trend line forming with resistance near $8,910 on the hourly chart of the BTC/USD pair. Bitcoin is clearly struggling to clear the trend line and the $9,000 resistance level.
If there is an upside break above the trend line resistance, the price could continue to rise towards the $9,100 resistance area. An intermediate resistance is near the $9,050 level or the 61.8% Fib retracement level of the key decline from the $9,305 swing high to $8,645 swing low.
To move into a positive zone and avoid more losses, the price must break the trend line resistance and then gain momentum above the $9,100 pivot level in the near term. In the mentioned case, the price could continue to rise towards the $9,330 and $9,500 resistance levels.
Bearish Break in BTC?
If bitcoin price fails to break the trend line resistance and $9,000, it might slide further. An initial support is near the $8,680 level and the $8,645 swing low.
A successful downside break below the $8,645 swing low could spark more losses. The next key support is near the $8,400 level, below which there are chances of a sustained downward move towards the $8,200 level in the coming days.
Technical indicators:
Hourly MACD – The MACD is about to move into the bearish zone.
Hourly RSI (Relative Strength Index) – The RSI for BTC/USD is declining and it is approaching the 40 level.
Major Support Levels – $8,645 followed by $8,400.
Major Resistance Levels – $8,950, $9,000 and $9,100.