
Reason to trust
How Our News is Made
Strict editorial policy that focuses on accuracy, relevance, and impartiality
Ad discliamer
Morbi pretium leo et nisl aliquam mollis. Quisque arcu lorem, ultricies quis pellentesque nec, ullamcorper eu odio.
Bitcoin is currently correcting lower from the $9,950-$10,000 resistance zone against the US Dollar. BTC price is likely to bounce back as long as it is above the $9,500 support.
- Bitcoin is currently showing a few bearish signs, but it is still above key supports such as $9,500.
- The price is finding a strong buying interest near $9,560 and the 100 hourly simple moving average.
- There is a major contracting triangle forming with resistance near $9,700 on the hourly chart of the BTC/USD pair (data feed from Kraken).
- The pair could surge towards $10,000 unless it breaks the $9,500 support and the 100 hourly SMA.
Bitcoin Testing Key Supports
Bitcoin retested the $9,950-$10,000 resistance zone against the US Dollar, but it failed to continue higher. BTC price traded as high as $9,945 and recently started a downside correction.
It failed to stay above the $9,800 and $9,700 levels. The decline was such that the price even spiked below the 50% Fib retracement level of the upward move from the $9,252 low to $9,945 high.
However, bitcoin is currently finding a strong buying interest above the $9,500 level and the 100 hourly simple moving average. The 61.8% Fib retracement level of the upward move from the $9,252 low to $9,945 high is also protecting more downsides. A confluence of these three factors could prevent a downside break and the price might start a fresh increase towards $10,000.
It seems like there is a major contracting triangle forming with resistance near $9,700 on the hourly chart of the BTC/USD pair. If the pair breaks the triangle resistance, it could start a fresh increase in the near term above $9,750.
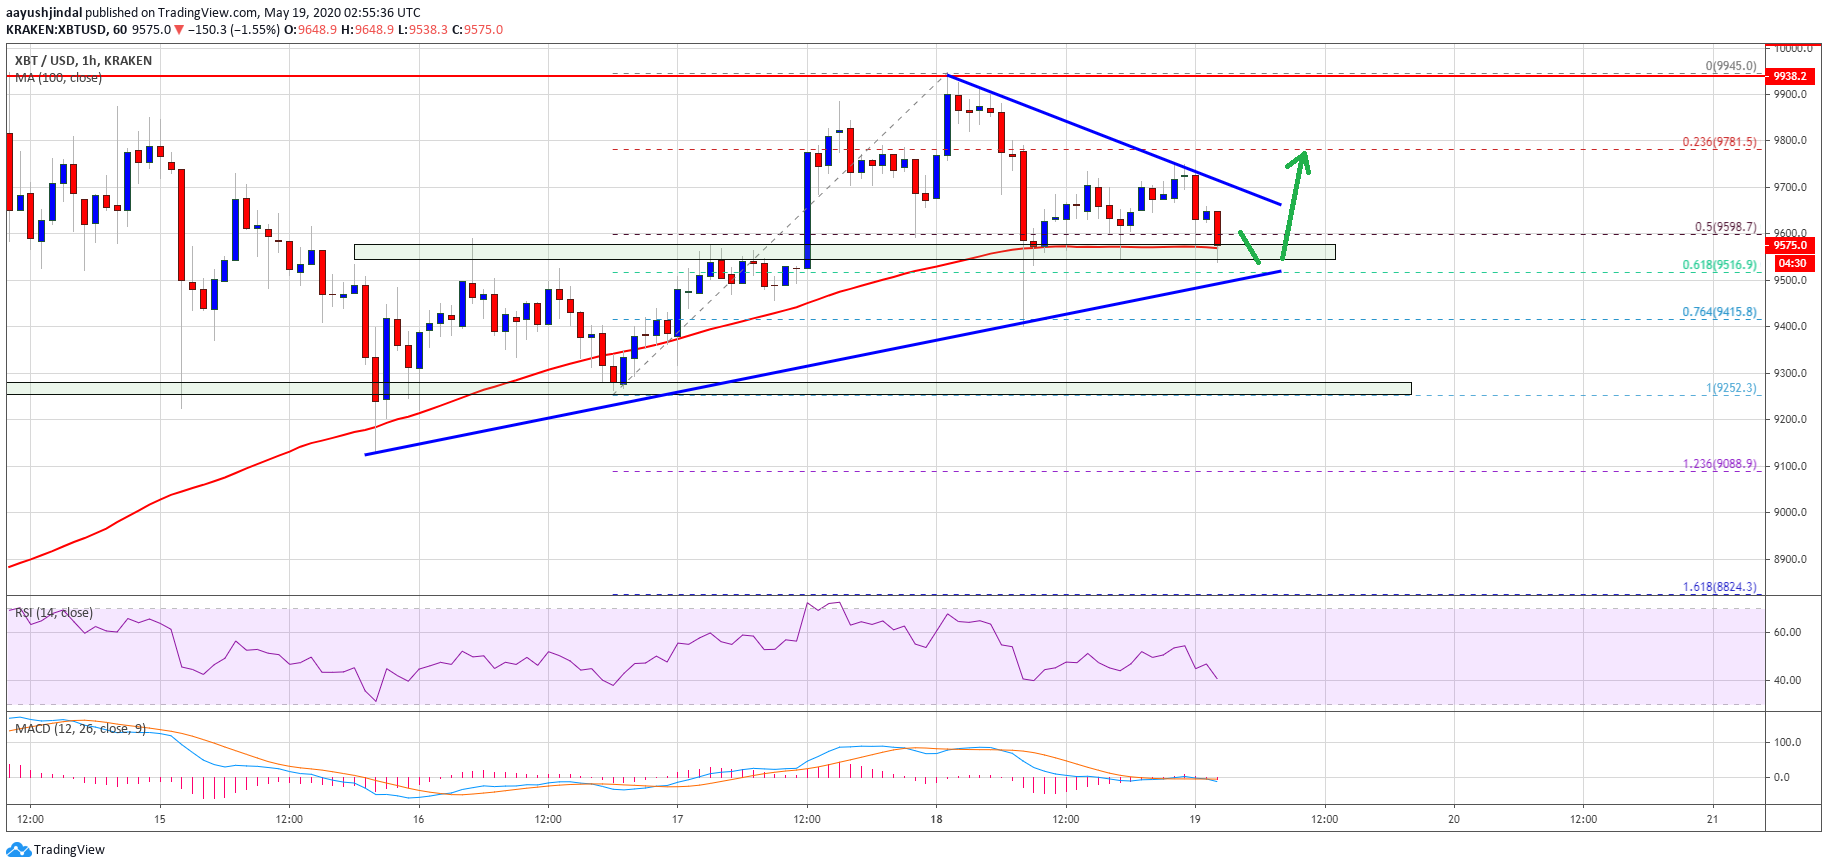
The first major resistance is near the $9,780 and $9,800. The main resistance is still near the $9,950-$10,000 zone, above which there are high chances of a sustained upward move in the coming days.
Bearish Break?
If bitcoin fails to climb higher above $9,700 and $9,800, it could react to the downside. A clear break below the triangle support, $9,500, and the 100 hourly SMA might initiate more losses.
The next key support is near the $9,400 level, below which the price is likely to continue lower towards the $9,250 support level. Any further losses may perhaps push the prince in a downtrend towards the $8,500 level.
Technical indicators:
Hourly MACD – The MACD is currently moving in the bearish zone, with negative signs.
Hourly RSI (Relative Strength Index) – The RSI for BTC/USD is now just below the 50 level.
Major Support Levels – $9,500 followed by $9,250.
Major Resistance Levels – $9,700, $9,800 and $10,000.
Featured image from unsplash.