
Reason to trust
How Our News is Made
Strict editorial policy that focuses on accuracy, relevance, and impartiality
Ad discliamer
Morbi pretium leo et nisl aliquam mollis. Quisque arcu lorem, ultricies quis pellentesque nec, ullamcorper eu odio.
Ethereum is showing signs of an upside correction from the $176 low against the US Dollar. However, ETH price is likely to face a major resistance near $195 and the 100 hourly SMA.
- Ethereum extended its decline and traded to a new weekly low at $176.
- The price is currently recovering and showing positive signs above $185.
- There is a major declining channel forming with resistance near $189 on the hourly chart of ETH/USD (data feed via Kraken).
- The bulls are likely to struggle and face a strong barrier near $195 and $198.
Ethereum Price is Facing Hurdles
After testing the $180 level, Ethereum made a recovery attempt above $185 against the US Dollar. ETH price climbed above the $188 resistance, but it struggled to surpass the $190 pivot level.
As a result, there was a fresh decline and the price broke the $180 low. A new weekly low was formed near $176 and the price is again correcting higher. It climbed above the 23.6% Fib retracement level of the key decline from the $214 high to $176 low.
Ethereum is now approaching the $190 resistance zone. There is also a major declining channel forming with resistance near $189 on the hourly chart of ETH/USD. If there is a clear break above the channel resistance and $190, the price could continue to recover.
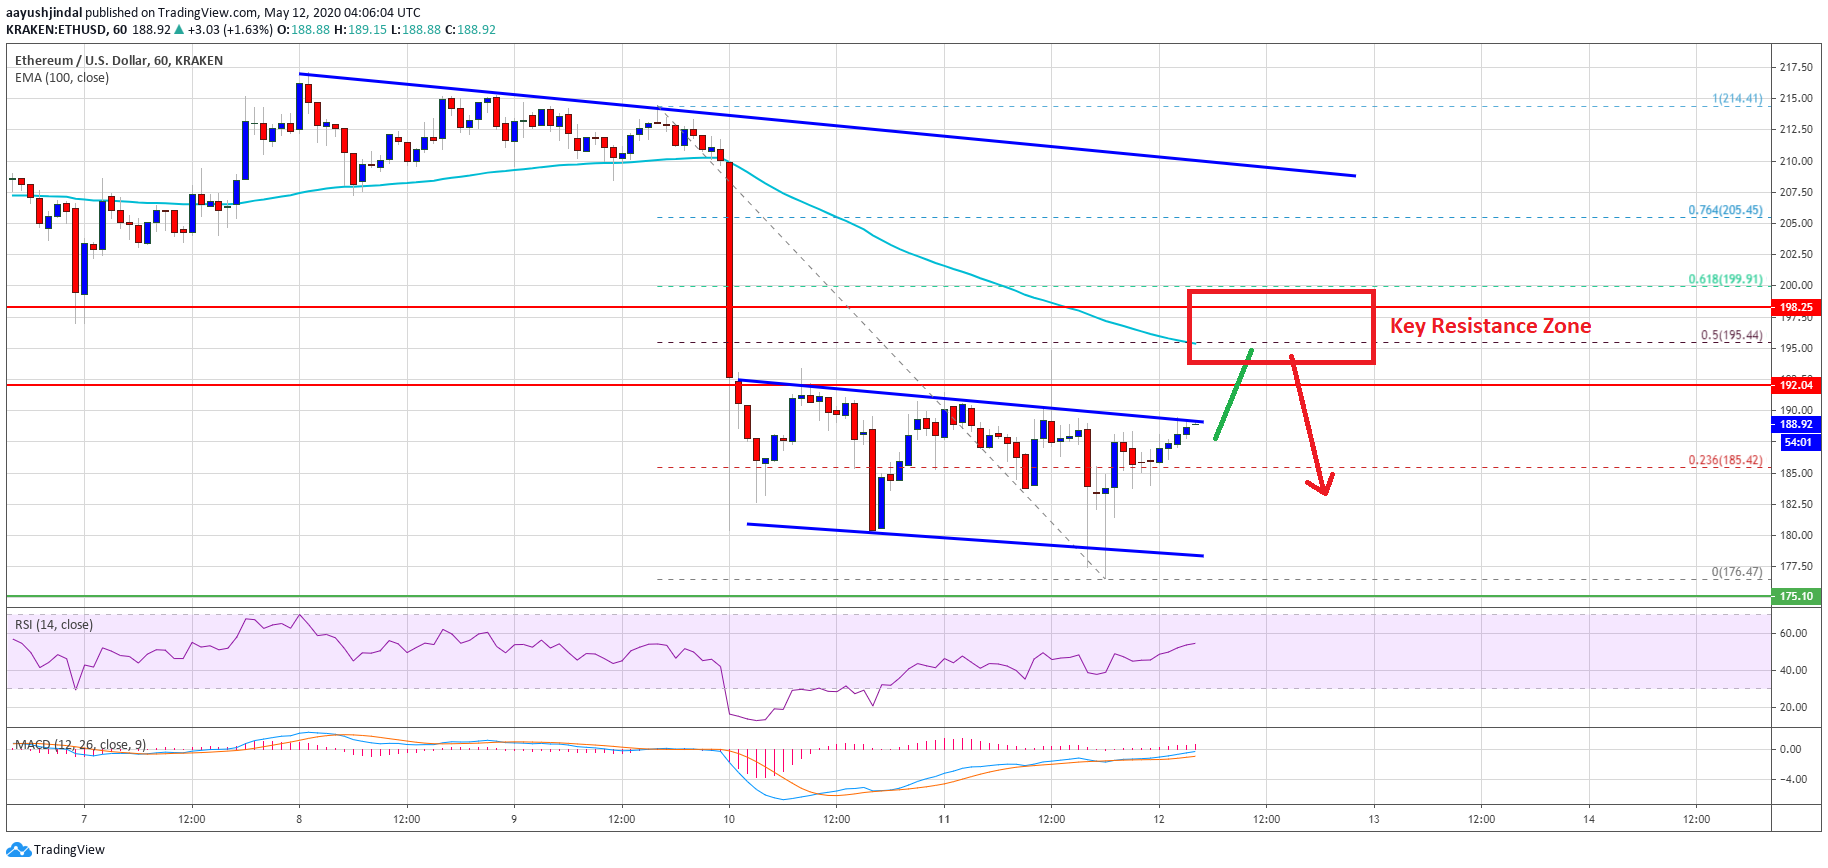
On the upside, there is a major resistance forming near the $195 level and the 100 hourly simple moving average. The 50% Fib retracement level of the key decline from the $214 high to $176 low is also near $195.
To start a decent upward move and a fresh bullish wave, ether price must surpass $195, 100 hourly SMA, and the $198 pivot level. A successful close above $198 will most likely open the doors for a push above the $200 and $202 resistance levels in the near term.
Bearish Continuation
If Ethereum fails to climb above the $190 and $195 resistance levels, it is likely to resume its decline. An immediate support is near the channel lower trend line at $177.
The key supports are near $176 and $175, below which the price could accelerate its drop towards the $165 level in the coming sessions.
Technical Indicators
Hourly MACD – The MACD for ETH/USD is currently moving in the bullish zone.
Hourly RSI – The RSI for ETH/USD is struggling to stay above the 50 level.
Major Support Level – $175
Major Resistance Level – $195
Take advantage of the trading opportunities with Plus500
Risk disclaimer: 76.4% of retail CFD accounts lose money.


