
Reason to trust
How Our News is Made
Strict editorial policy that focuses on accuracy, relevance, and impartiality
Ad discliamer
Morbi pretium leo et nisl aliquam mollis. Quisque arcu lorem, ultricies quis pellentesque nec, ullamcorper eu odio.
Ripple is trading in a broad range above the $0.2100 support against the US Dollar. XRP declined below a key support versus bitcoin and it is now at a risk of a sharp decline vs USD.
- Ripple is facing hurdles near the $0.2200 and $0.2220 resistance levels against the US dollar.
- It seems like the price is preparing for a major break either above $0.2250 or below $0.2100.
- There is a short term rising channel forming with support near $0.2160 on the hourly chart of the XRP/USD pair (data source from Kraken).
- The pair could decline heavily below the $0.2150 and $0.2100 support levels.
Ripple Price Remains At Risk
Bitcoin price started a strong rise above $9,500 and climbed towards $10,000, but ripple failed to follow through. As a result, XRP to BTC broke a couple of key supports levels, increasing pressure on XRP/USD.
The recent swing high was formed near $0.2225 before the price started a downside correction. There was a break below the $0.2200 support level. The price is now trading below the 23.6% Fib retracement level of the upward move from the $0.2110 low to $0.2225 high.
It seems like there is a short term rising channel forming with support near $0.2160 on the hourly chart of the XRP/USD pair. The channel support is close to the 50% Fib retracement level of the upward move from the $0.2110 low to $0.2225 high.
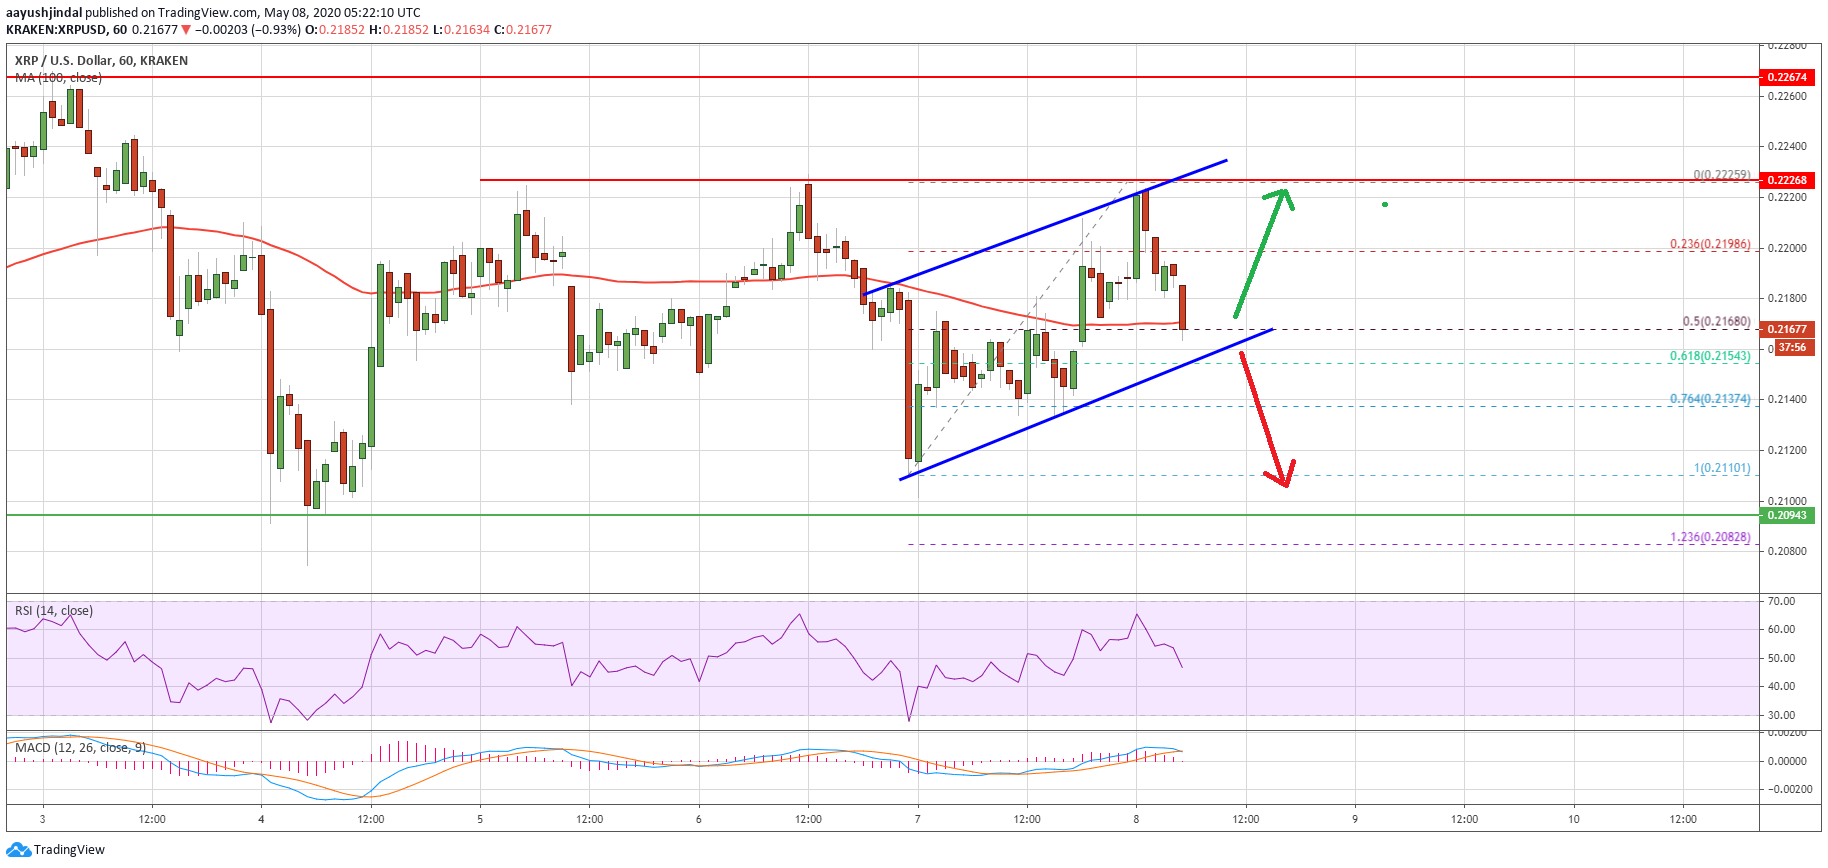
The 100 hourly simple moving average is also acting as a strong support near $0.2160. If ripple fails to stay above the $0.2160 and $0.2150 support levels, it could continue to move down towards the $0.2100 support.
Any further losses might risk a strong decline towards the $0.2000 and $0.1980 support levels in the coming sessions.
Chances of Upside Break
If ripple starts a strong increase from $0.2160 and breaks the $0.2220 resistance, it could continue to rise. The next key resistance on the upside is near the $0.2265 level.
A successful close above the $0.2265 level is needed for a push towards the $0.2350 level. Any further gains could open the doors for a larger rally towards the $0.2400 and $0.2500 levels.
Technical Indicators
Hourly MACD – The MACD for XRP/USD is slowly moving back into the bearish zone.
Hourly RSI (Relative Strength Index) – The RSI for XRP/USD is currently well above the 50 level.
Major Support Levels – $0.2150, $0.2100 and $0.2080.
Major Resistance Levels – $0.2200, $0.2220 and $0.2350.
Take advantage of the trading opportunities with Plus500
Risk disclaimer: 76.4% of retail CFD accounts lose money.