
Reason to trust
How Our News is Made
Strict editorial policy that focuses on accuracy, relevance, and impartiality
Ad discliamer
Morbi pretium leo et nisl aliquam mollis. Quisque arcu lorem, ultricies quis pellentesque nec, ullamcorper eu odio.
Bitcoin is up more than 7% and it broke the $10,000 resistance against the US Dollar. BTC is showing many bullish signs on the daily chart and it is likely to test $10,500.
- Bitcoin is gaining bullish momentum and it recently spiked above $10,000.
- The current crypto market sentiment is very positive, suggesting more upsides towards $10,500.
- There was a break above a crucial bearish trend line with resistance near $7,800 on the daily chart of the BTC/USD pair (data feed from Kraken).
- Ethereum and ripple are slowly gaining momentum, but they are still below weekly resistances.
Bitcoin Rallies To $10,000
Yesterday, we discussed the chances of a massive rally in bitcoin if it breaks the $9,500 resistance against the US Dollar. BTC price did surpass a few hurdles near $9,400 and $9,500 to start a significant upward move.
It all started when the bulls managed to push the price above the $7,800 resistance area and the 100-day simple moving average. It opened the doors for a sharp rise above the $8,000 resistance area.
There was also a break above a crucial bearish trend line with resistance near $7,800 on the daily chart of the BTC/USD pair. Recently, the pair consolidated near the $9,000 resistance, and the 61.8% Fib retracement level of the main decline from the $10,497 swing high to $3,892 low.
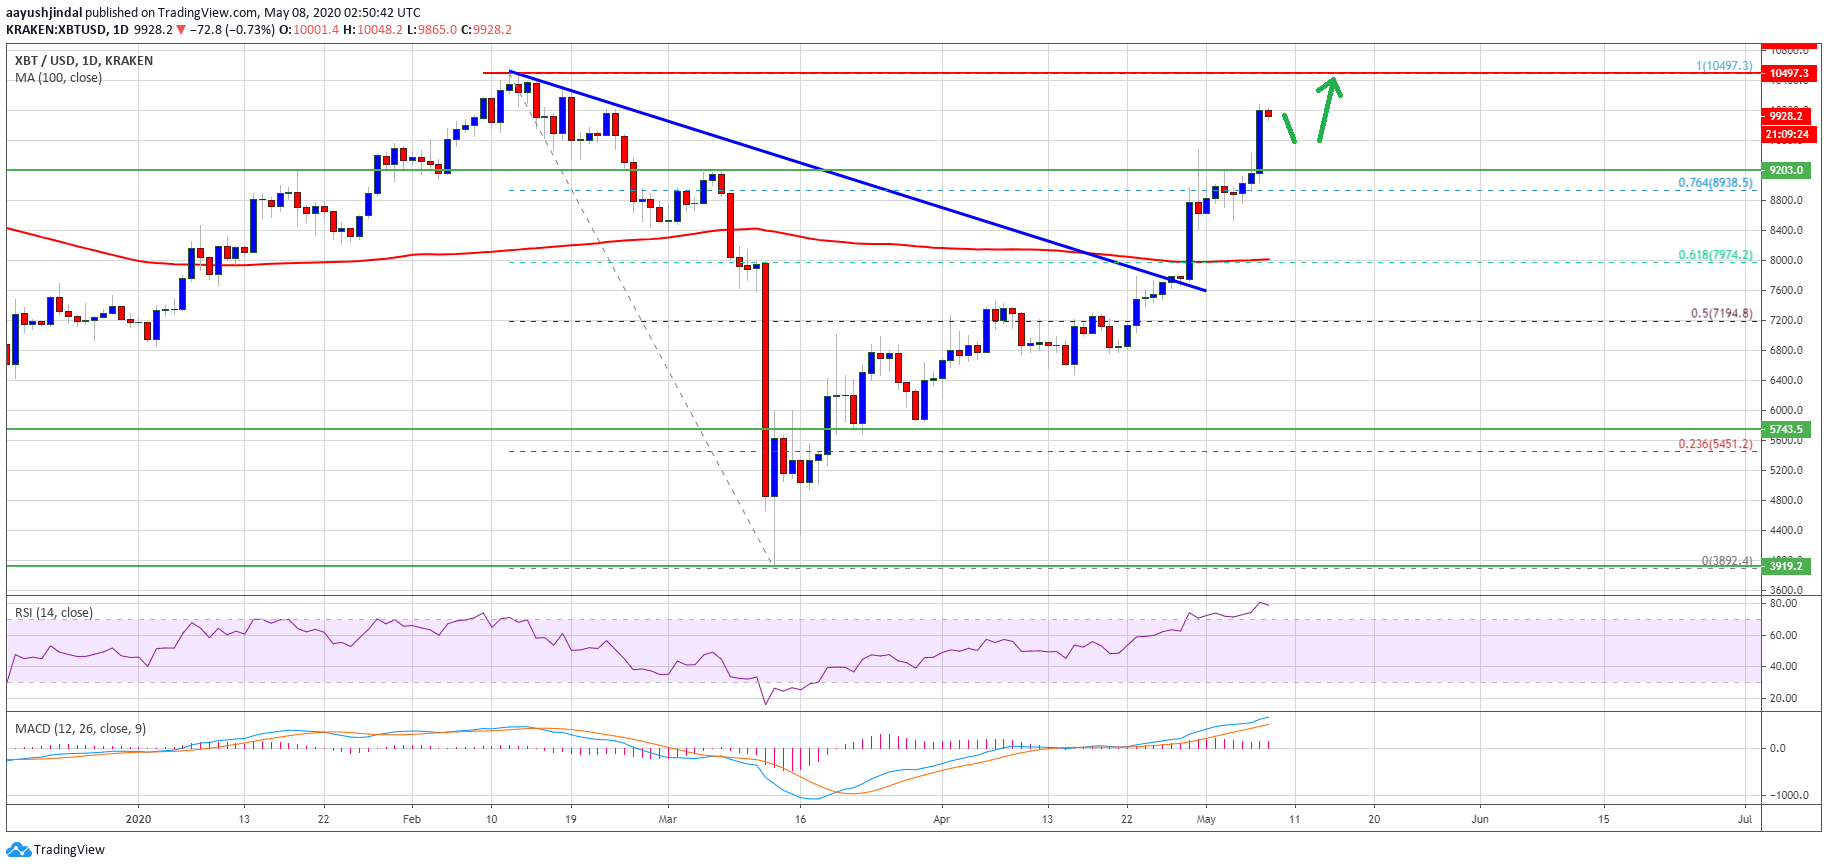
The bulls gained strength, resulting in a push above the $9,000 and $9,500 resistance levels. Bitcoin even spiked above $10,000 and it is now trading above the 76.4% Fib retracement level of the main decline from the $10,497 swing high to $3,892 low.
It seems like the price is likely to continue higher towards the $10,500 swing high (formed in Feb 2020). Any further gains could lead the price towards the $11,000 and $11,200 resistance levels in the near term.
Short Term Pullback?
In the short term, bitcoin price might correct a few points below the $9,800 level. On the downside, the first support is seen near the $9,500 level (the recent breakout zone).
The main support is now forming near the $9,200 level, where the bulls are likely to take a stand. Any further gains may perhaps call for a test of the $8,000 support or the 100-day simple moving average.
Technical indicators:
Daily MACD – The MACD is currently gaining momentum in the bullish zone.
Daily RSI (Relative Strength Index) – The RSI for BTC/USD is now in the overbought zone.
Major Support Levels – $9,500 followed by $9,200.
Major Resistance Levels – $10,200, $10,500 and $11,000.


