
Reason to trust
How Our News is Made
Strict editorial policy that focuses on accuracy, relevance, and impartiality
Ad discliamer
Morbi pretium leo et nisl aliquam mollis. Quisque arcu lorem, ultricies quis pellentesque nec, ullamcorper eu odio.
Ripple is facing a couple of hurdles near $0.2220 against the US Dollar. XRP is likely to accelerate higher above $0.2220 unless the bulls lose control and the price drops below $0.2080.
- Ripple price is currently approaching the $0.2200 and $0.2220 resistance levels against the US dollar.
- It seems like a strong support base is forming near the $0.2120 and $0.2080 levels.
- There is a key bearish trend line forming with resistance near $0.2190 on the hourly chart of the XRP/USD pair (data source from Kraken).
- There could be a sustained upward move if the price clears the $0.2220 resistance zone.
Ripple Price Could Continue Higher
Recently, ripple made an attempt to continue higher above the $0.2220 resistance, but it failed. XRP price formed a high near $0.2224 and recently started a downside correction.
There was a break below the $0.2200 support and the 100 hourly simple moving average. It even traded below the 23.6% Fib retracement level of the upward move from the $0.2074 low to $0.2224 high.
On the downside, the $0.2150 support area is acting as a decent buy zone. It is close to the 50% Fib retracement level of the upward move from the $0.2074 low to $0.2224 high.
Ripple is currently rising and approaching the 100 hourly SMA at $0.2190. More importantly, there is a key bearish trend line forming with resistance near $0.2190 on the hourly chart of the XRP/USD pair.
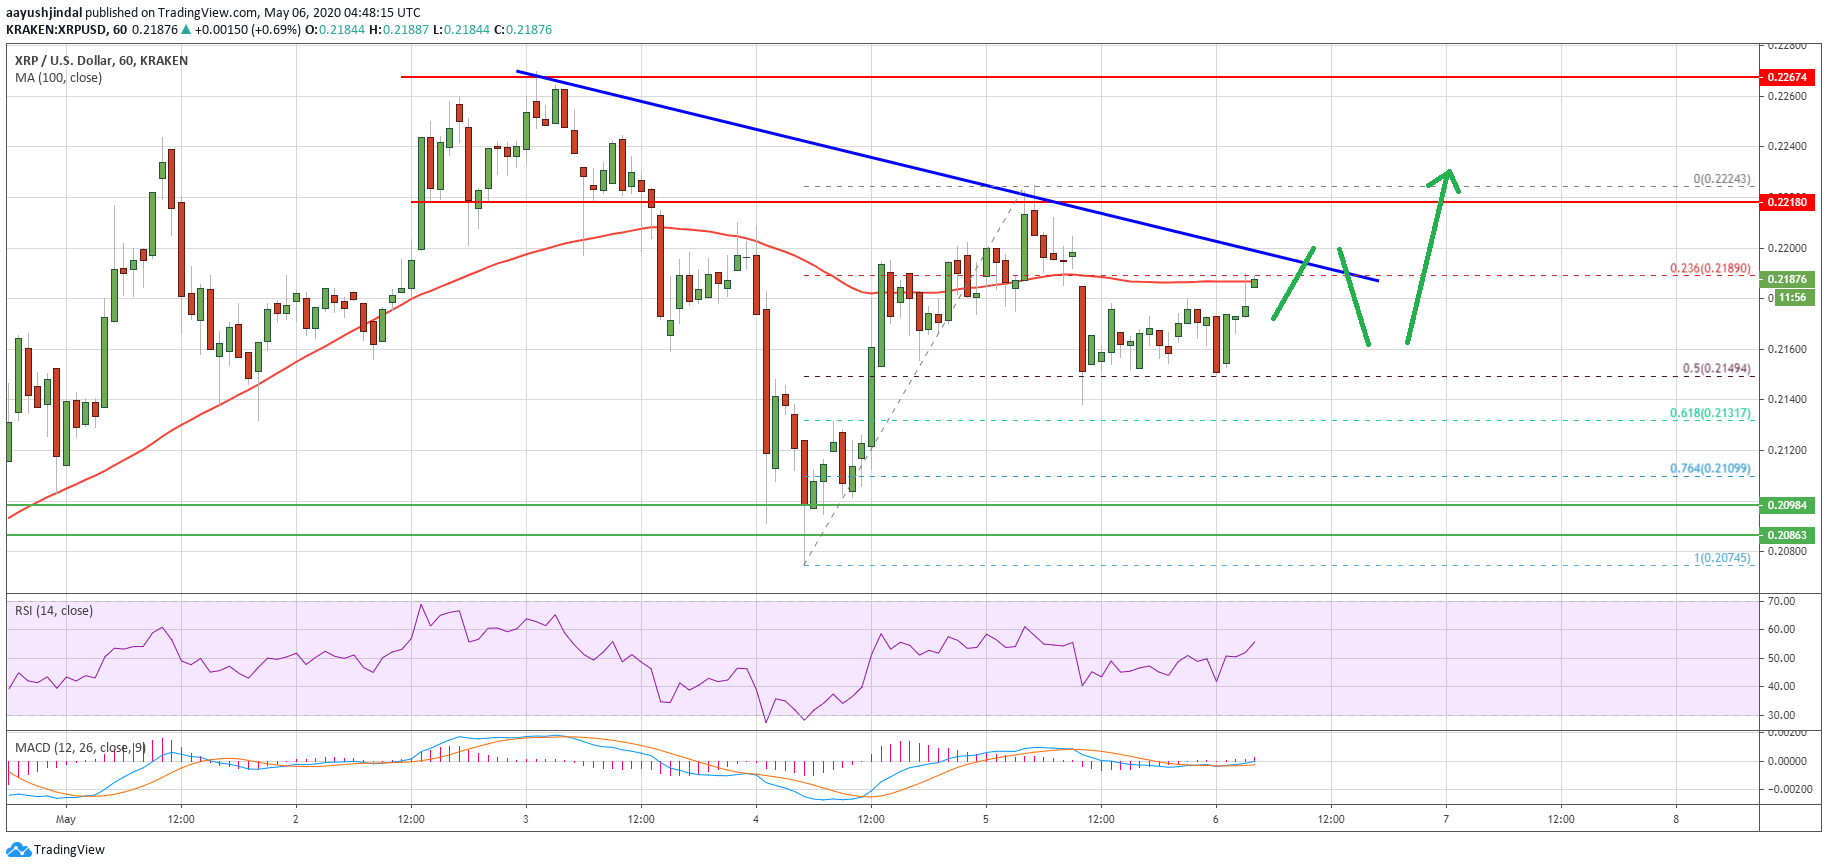
If there is an upside break above $0.2190 and $0.2200, the price could make another attempt to surpass the $0.2220 resistance level. If the bulls gain strength above $0.2220, the price is likely to continue higher towards the $0.2320 and $0.2350 resistance levels in the coming sessions.
Another Rejection?
If ripple fails to continue higher above $0.2200 or $0.2220, it could react to the downside. An initial support on the downside is near the $0.2150 level.
The first major support is near the $0.2100 level, below which the $0.2080 support could act as a strong buy zone. If the bears succeed in clearing the $0.2080 support, there is a risk of a drop towards $0.2000.
Technical Indicators
Hourly MACD – The MACD for XRP/USD is slowly gaining momentum in the bullish zone.
Hourly RSI (Relative Strength Index) – The RSI for XRP/USD is currently well above the 50 level.
Major Support Levels – $0.2150, $0.2100 and $0.2080.
Major Resistance Levels – $0.2200, $0.2220 and $0.2350.
Take advantage of the trading opportunities with Plus500
Risk disclaimer: 76.4% of retail CFD accounts lose money.