
Reason to trust
How Our News is Made
Strict editorial policy that focuses on accuracy, relevance, and impartiality
Ad discliamer
Morbi pretium leo et nisl aliquam mollis. Quisque arcu lorem, ultricies quis pellentesque nec, ullamcorper eu odio.
Ripple failed to stay above the $0.2200 support and declined recently against the US Dollar. XRP price is showing bearish signs and it could continue to dive towards $0.2000.
- Ripple price topped near the $0.2269 level and declined recently against the US dollar.
- It is now trading well below the $0.2200 pivot level and the 100 hourly simple moving average.
- There was a break below a key bullish trend line with support near $0.2185 on the hourly chart of the XRP/USD pair (data source from Kraken).
- The pair is likely to continue lower towards the $0.2000 support level in the near term.
Ripple Price Could Extend Losses
After a steady rise, ripple struggled to continue above the $0.2260 and $0.2280 levels. XRP formed a short term top near the $0.2269 level and recently started a strong decline.
There was a break below the key $0.2200 support and the 100 hourly simple moving average. More importantly, there was a break below a key bullish trend line with support near $0.2185 on the hourly chart of the XRP/USD pair.
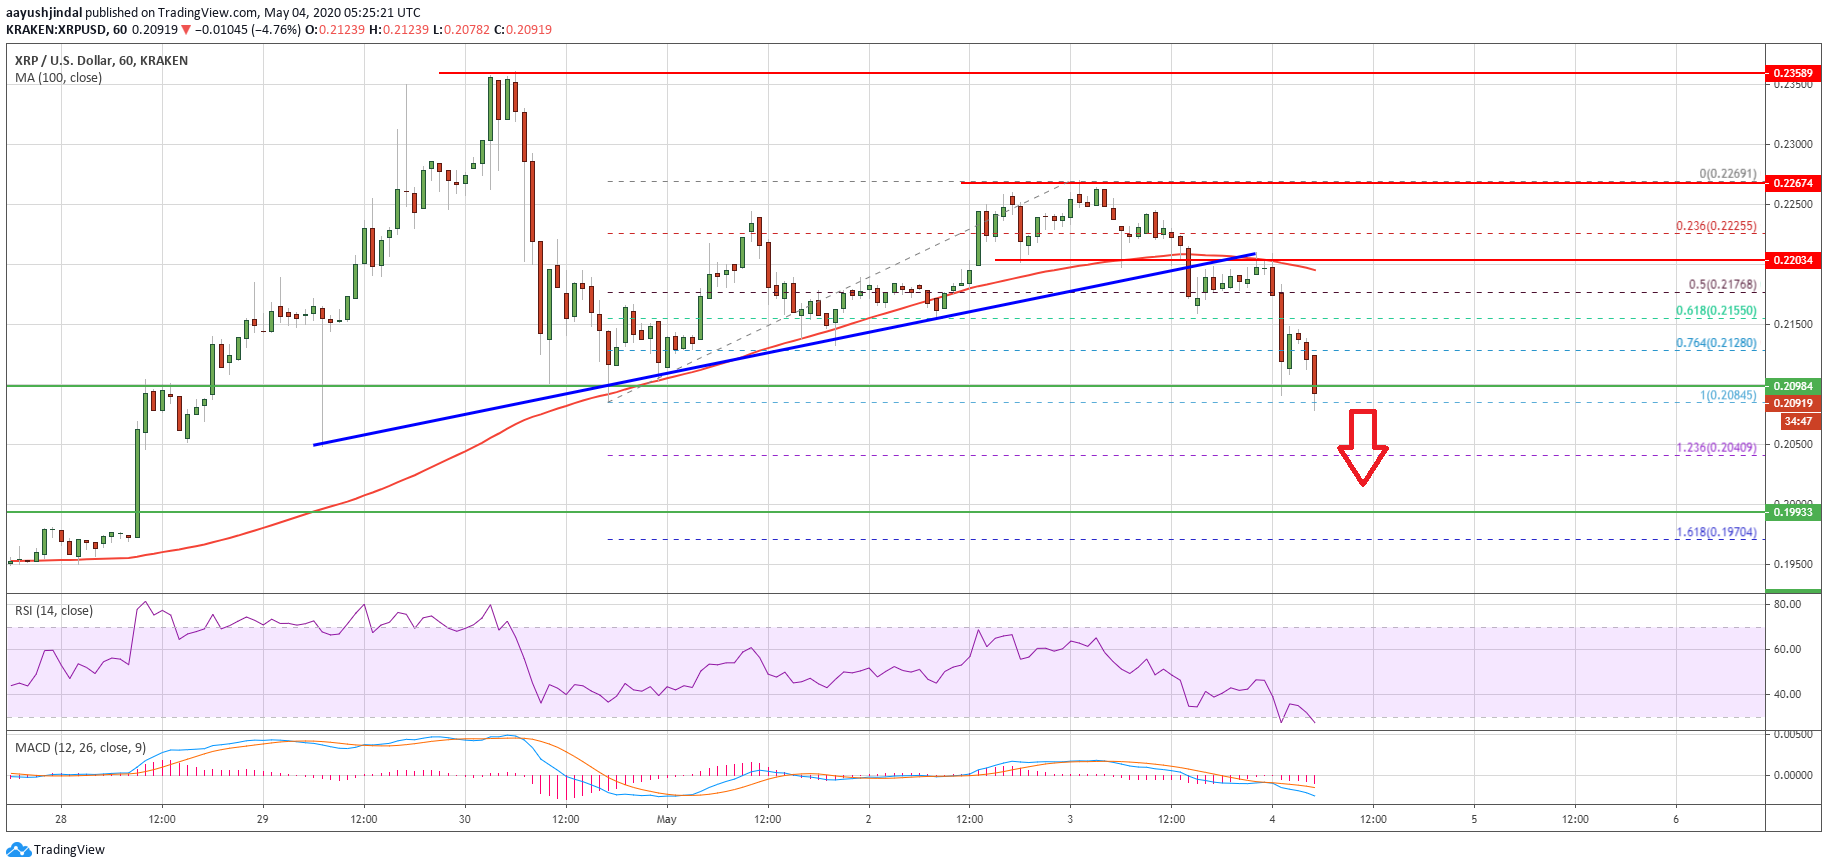
The pair is now trading well below the 76.4% Fib retracement level of the upward move from the $0.2084 low to $0.2269 high. Ripple is now trading near the last swing low at $0.2085.
If the bears remain in action, there is a risk of more losses below $0.2080. An immediate support is seen near the $0.2040 level. The first key support is near the $0.2000 area.
The 1.618 Fib extension level of the upward move from the $0.2084 low to $0.2269 high is the next major support near the $0.1970 level. Any further losses could open the doors for a larger decline towards the $0.1920 and $0.1900 support levels.
Key Hurdles
Ripple is clearly trading in a short term bearish zone below the $0.2150 and $0.2100 levels. If the price attempts a recovery, it could face hurdles near the $0.2120 level.
The main resistance is near the $0.2200 level and the 100 hourly SMA, above which the price is likely to retest the $0.2265 pivot level in the coming sessions.
Technical Indicators
Hourly MACD – The MACD for XRP/USD is gaining pace in the bearish zone.
Hourly RSI (Relative Strength Index) – The RSI for XRP/USD is currently declining and it is well below the 35 level.
Major Support Levels – $0.2040, $0.2000 and $0.1970.
Major Resistance Levels – $0.2120, $0.2200 and $0.2220.
Take advantage of the trading opportunities with Plus500
Risk disclaimer: 76.4% of retail CFD accounts lose money.