
Reason to trust
How Our News is Made
Strict editorial policy that focuses on accuracy, relevance, and impartiality
Ad discliamer
Morbi pretium leo et nisl aliquam mollis. Quisque arcu lorem, ultricies quis pellentesque nec, ullamcorper eu odio.
Ethereum surged to a new monthly high at $227 before correcting lower against the US Dollar. ETH price is now testing the $205 support zone and it is likely to start a fresh rally.
- Ethereum started a downside correction after a strong rally above $220.
- The price is currently trading above the key uptrend supports at $205 and $200.
- There is a short term contracting triangle forming with resistance near $210 on the hourly chart of ETH/USD (data feed via Kraken).
- The pair is likely to start a fresh increase above $210 as long as it is above $200.
Ethereum Price Correcting Gains
Yesterday, we saw a sharp rise in Ethereum above the $200 hurdle against the US Dollar. ETH surged more than 10% and even climbed above the $220 level and the 100 hourly simple moving average.
It traded to a new monthly high at $227 and recently started a downside correction, similar to bitcoin. There was a break below the $212 and $210 support levels.
Ether price even spiked below the $205 support, but it remained well bid above the $200 support and the 100 hourly simple moving average. It is currently trading above the 23.6% Fib retracement level of the recent decline from the $227 high to $203 swing low.
An initial resistance on the upside is near the $210 level. There is also a short term contracting triangle forming with resistance near $210 on the hourly chart of ETH/USD.
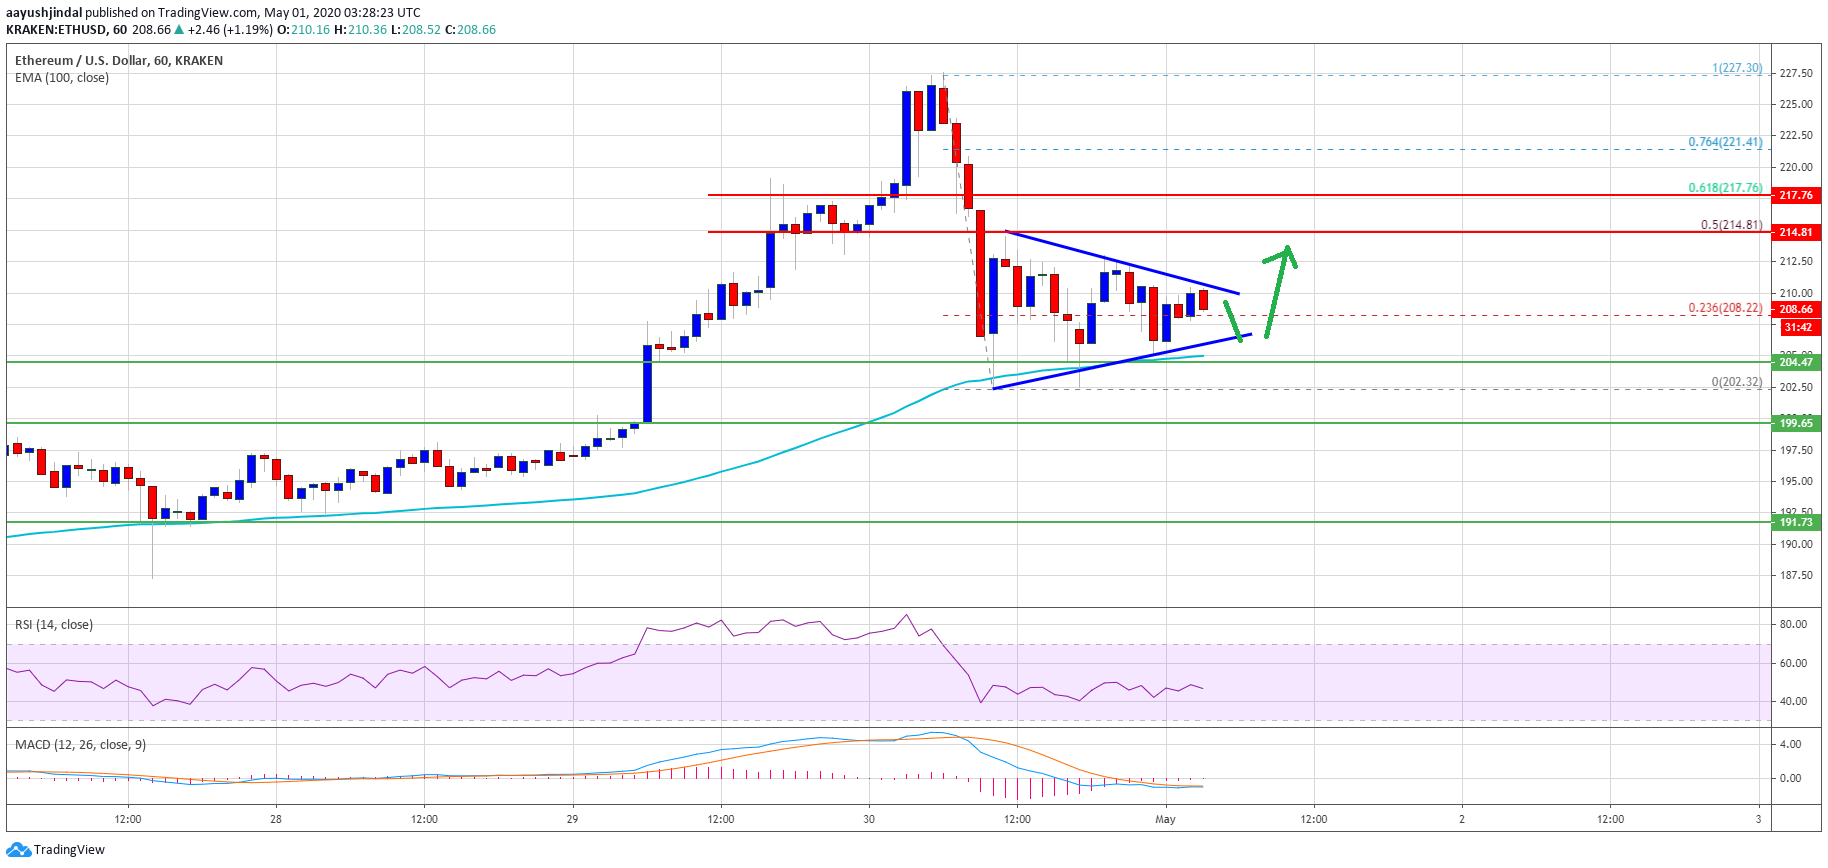
If there is an upside break above the triangle resistance, Ethereum could test the $215 resistance area. The 50% Fib retracement level of the recent decline from the $227 high to $203 swing low is also near $215.
A successful break above the $215 resistance area is must to start a fresh increase and rally above the $220 resistance area in the near term.
Key Uptrend Support
The main uptrend supports on the downside are near $205, $202 and the 100 hourly SMA. If Ethereum fails to stay above the $200 support zone, there is a risk of a larger decline.
In the mentioned bearish case below the $200 support, the price is likely to continue lower towards the $192 and $190 support levels in the coming sessions.
Technical Indicators
Hourly MACD – The MACD for ETH/USD is about to move back into the bullish zone.
Hourly RSI – The RSI for ETH/USD is currently struggling to climb above the 50 level.
Major Support Level – $202
Major Resistance Level – $215