
Reason to trust
How Our News is Made
Strict editorial policy that focuses on accuracy, relevance, and impartiality
Ad discliamer
Morbi pretium leo et nisl aliquam mollis. Quisque arcu lorem, ultricies quis pellentesque nec, ullamcorper eu odio.
Bitcoin rallied to $9,500 before starting a downside correction against the US Dollar. BTC price might dip towards the $8,200 support zone before a fresh increase.
- Bitcoin jumped more than 20% and tested the main target of $9,500 (as discussed yesterday).
- The price is down more than 8% and it is now trading well below the $9,000 level.
- There is a short term declining channel forming with resistance near $8,800 on the hourly chart of the BTC/USD pair (data feed from Kraken).
- The pair could correct further towards $8,400 or $8,200 before a fresh increase.
Bitcoin Correcting Gains
Yesterday, we saw a strong pre-halving rally in bitcoin above the $8,000 and $8,500 resistance levels against the US Dollar. BTC price gained more than 20% and it even tested the main target of $9,500 (as discussed yesterday’s analysis using the daily chart).
A new monthly high is formed near $9,498 and the price recently started a substantial downside correction. There was a break below the $9,200 and $9,000 support levels.
Bitcoin even dived below the $8,800 level and tested the $8,400 support area. A low is formed near $8,405 and the price is currently trading above the 23.6% Fib retracement level of the recent decline from the $9,498 high to $8,405 low.
On the upside, an initial resistance is near the $8,800 level. There is also a short term declining channel forming with resistance near $8,800 on the hourly chart of the BTC/USD pair.
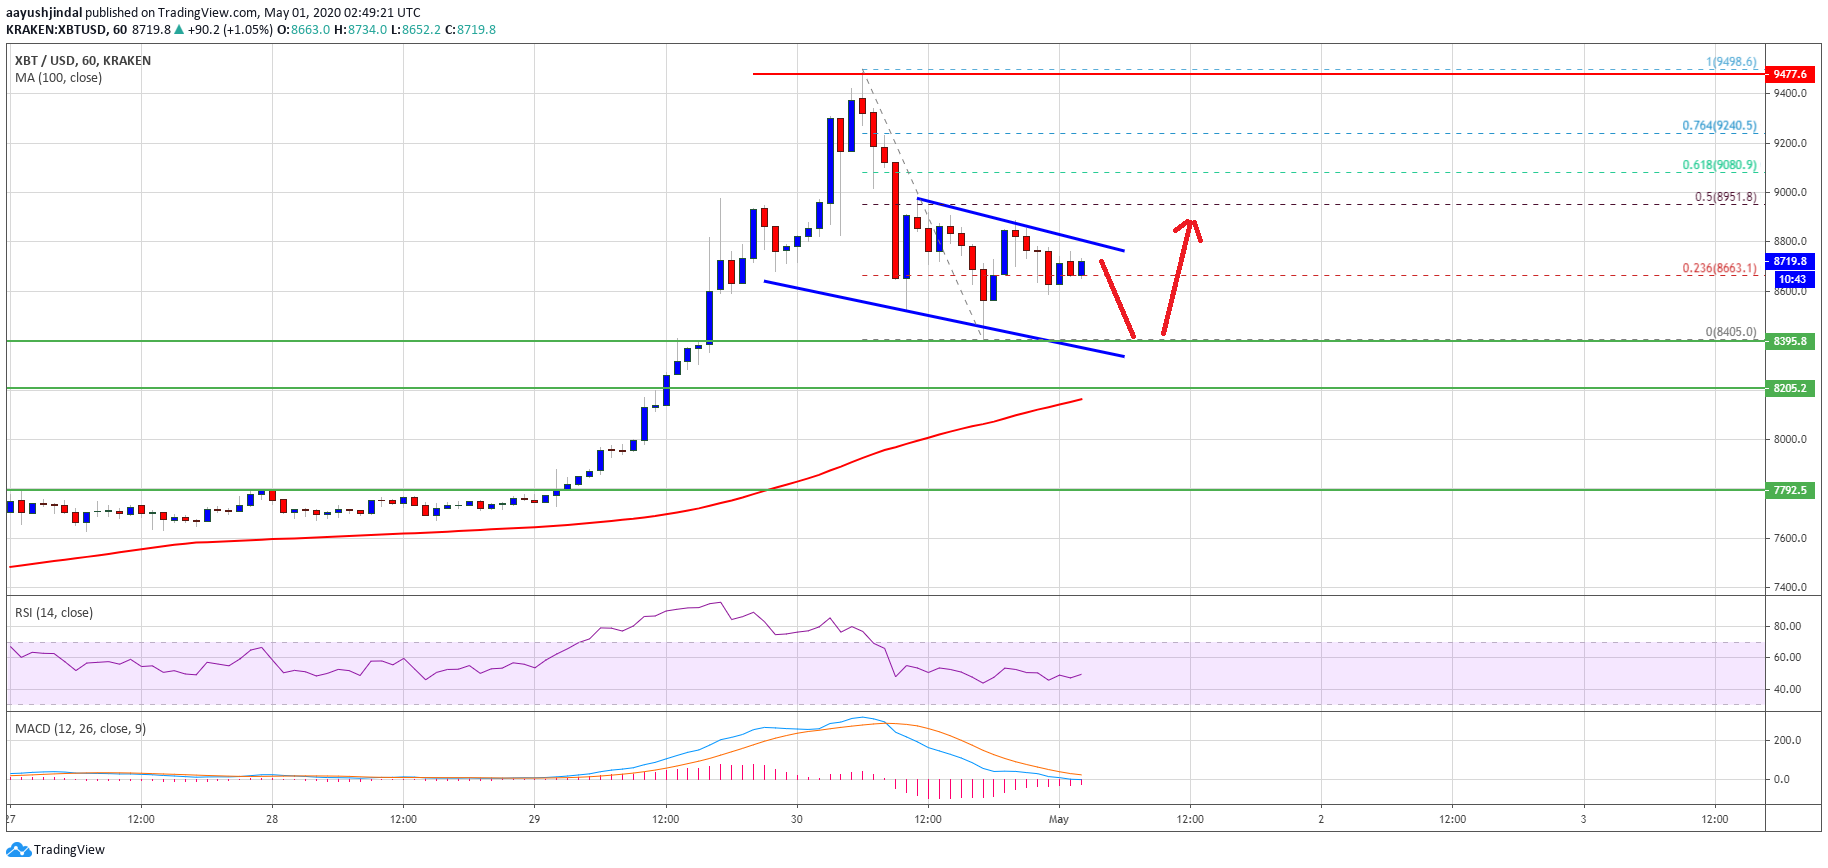
Above the channel resistance, the next resistance is near the $8,950. It is close to the 50% Fib retracement level of the recent decline from the $9,498 high to $8,405 low.
To start a fresh increase, the bulls need to push the price above the channel resistance and then clear the $8,950 resistance. A successful follow through above the $9,000 level could pump the price towards the $9,200 and $9,500 levels in the near term.
Downside Thrust
On the downside, the first major support for bitcoin buyers is near the $8,400 level. The next major support is near the $8,200 level or the 100 hourly simple moving average.
It seems like the price might dive towards the $8,400 support or the 100 hourly SMA to complete the current wave. Later, it is likely to start a fresh increase above $9,000 unless there is a close below $8,200.
Technical indicators:
Hourly MACD – The MACD is about to move into the bullish zone.
Hourly RSI (Relative Strength Index) – The RSI for BTC/USD is currently rising and it is near the 50 level.
Major Support Levels – $8,400 followed by $8,200.
Major Resistance Levels – $8,800, $8,950 and $9,000.


