
Reason to trust
How Our News is Made
Strict editorial policy that focuses on accuracy, relevance, and impartiality
Ad discliamer
Morbi pretium leo et nisl aliquam mollis. Quisque arcu lorem, ultricies quis pellentesque nec, ullamcorper eu odio.
Ethereum is up more than 12% and it broke the $220 resistance against the US Dollar. ETH price is likely to continue higher and it could even test the $240 and $250 levels.
- Ethereum is surging and it recently broke the $215 and $220 resistance levels.
- The price is now trading well above the $200 pivot level and the 100-day simple moving average.
- There was a break above a major bearish trend line with resistance near $200 on the daily chart of ETH/USD (data feed via Kraken).
- The pair is likely to continue higher towards the $240 and $250 resistance levels.
Ethereum Price Primary Target Hit
Yesterday, we discussed the chances of a strong rise in Ethereum above the $200 resistance against the US Dollar. ETH price did gain bullish momentum above $200 and surged more than 12%.
Bitcoin also rallied more than 15% above $8,000 and $8,500. It sparked more upsides in Ether above the $210 level and the price tested the first bullish target of $220 (as discussed in yesterday’s post).
During the rise, there was a break above the 50% Fib retracement level of the last key decrease from the $287 high to $90 swing low. Moreover, there was a break above a major bearish trend line with resistance near $200 on the daily chart of ETH/USD.
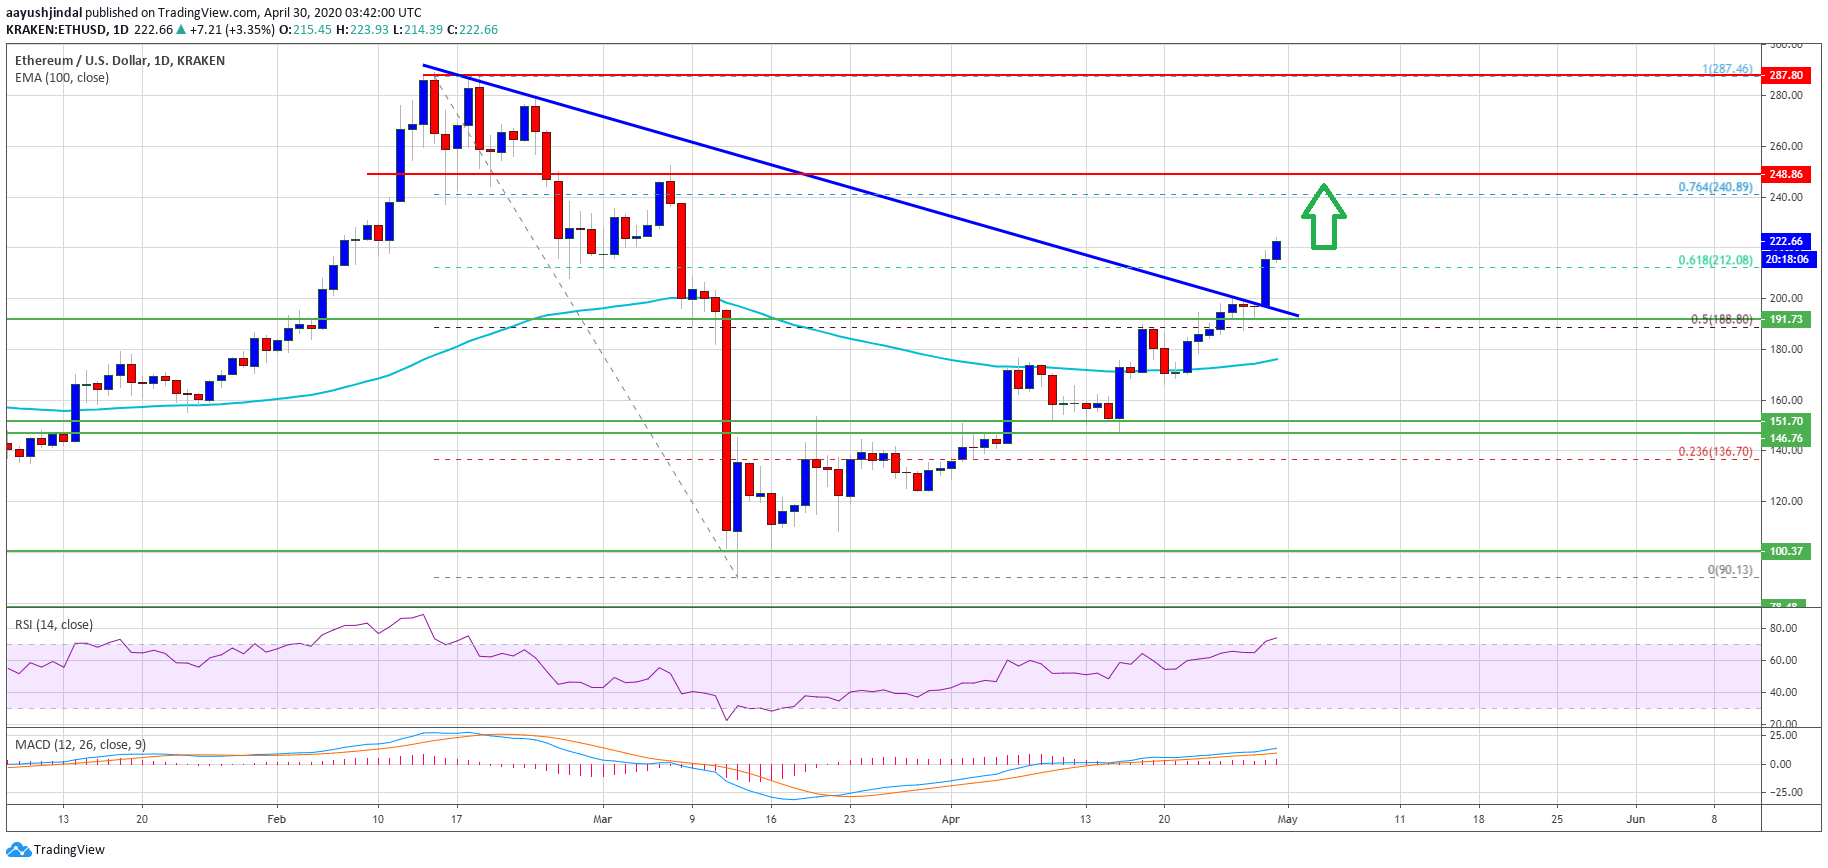
Ethereum is now trading nicely in a strong uptrend above the $220 level. An initial resistance on the upside is seen near the $240 level. It is close to the 76.4% Fib retracement level of the last key decrease from the $287 high to $90 swing low.
The next key resistance is near the $250 level (a multi-touch zone). If the bulls continue to gain strength, there are high chances of more upsides above the $240 and $250 resistance levels.
Chances of a Downside Correction?
If Ethereum fails to clear the $240 resistance level, there are slight chances of a downside correction. An initial support is near the $212 level.
The first major support is now near the $200 level and the same broken bearish trend line. If the price fails to stay above the key $200 support zone, there is a risk of a larger correction towards $185.
Technical Indicators
Daily MACD – The MACD for ETH/USD is gaining momentum in the bullish zone.
Daily RSI – The RSI for ETH/USD is currently near the overbought levels.
Major Support Level – $200
Major Resistance Level – $250
Take advantage of the trading opportunities with Plus500
Risk disclaimer: 76.4% of retail CFD accounts lose money.