
Reason to trust
How Our News is Made
Strict editorial policy that focuses on accuracy, relevance, and impartiality
Ad discliamer
Morbi pretium leo et nisl aliquam mollis. Quisque arcu lorem, ultricies quis pellentesque nec, ullamcorper eu odio.
Bitcoin is up more than 15% in a pre-halving rally against the US Dollar. BTC broke the key $8,000 resistance and the 100-day simple moving average to open the doors for $9,500 or $10,000.
- Bitcoin is surging and it settled nicely above the $8,000 resistance pivot level against the US Dollar.
- The price is gaining momentum above the 100-day simple moving average and it could test $9,500.
- There is a major bullish trend line forming with support at $7,400 on the daily chart of the BTC/USD pair (data feed from Kraken).
- The pair could correct in the short term, but dips remain well bid near $8,000.
Bitcoin Price Surging Towards $9,500 and $10,000
Yesterday, we discussed how bitcoin price could start a pre halving rally against the US Dollar. BTC price broke a few important resistance levels near the $8,000 zone to move into a strong uptrend.
The bulls gained strength above the $8,000 level and the 100-day simple moving average. There was a break above the 61.8% Fib retracement level of the last key decline from the $10,495 swing high to $3,931 low.
Bitcoin cleared a connecting resistance trend line with resistance near $8,020 on the daily chart. It opened the doors for sharp rise and the price rallied above the $8,500 level. It tested the 76.4% Fib retracement level of the last key decline from the $10,495 swing high to $3,931 low.
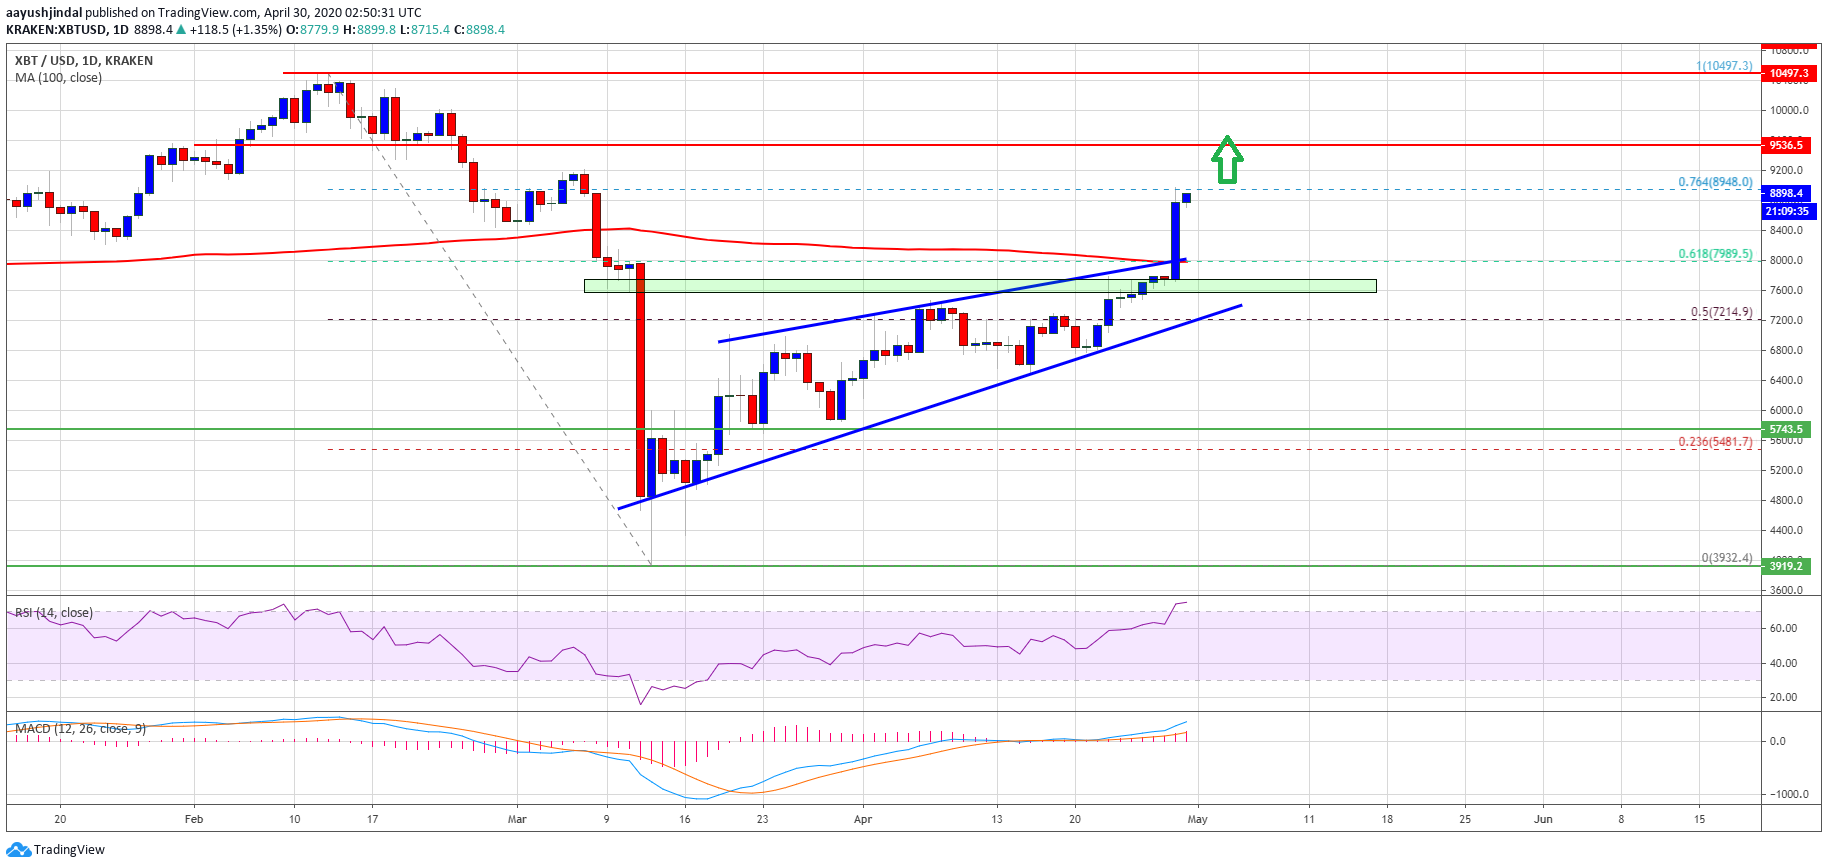
Clearly, the bulls are in control, signaling a strong rise above the $8,800 and $9,000 resistance levels. The next major resistance is near the $9,500 level (a multi-touch zone).
Any further gains above the $9,500 resistance could start a convincing upward move towards the $10,000 resistance level in the near term.
Downside Correction?
The current rise in bitcoin could face hurdles near the $9,500 resistance level. If it starts a downside correction, there are many supports waiting on the downside starting with $8,500.
The first major support is near the $8,000 level (the recent breakout zone). There is also a major bullish trend line forming with support at $7,400 on the same chart. Overall, dips remain well supported on the downside if the price corrects lower from the current levels or $9,500.
Technical indicators:
Daily MACD – The MACD is currently gaining momentum in the bullish zone.
Daily RSI (Relative Strength Index) – The RSI for BTC/USD is now in the overbought zone.
Major Support Levels – $8,500 followed by $8,000.
Major Resistance Levels – $9,000, $9,400 and $9,500.


