
Reason to trust
How Our News is Made
Strict editorial policy that focuses on accuracy, relevance, and impartiality
Ad discliamer
Morbi pretium leo et nisl aliquam mollis. Quisque arcu lorem, ultricies quis pellentesque nec, ullamcorper eu odio.
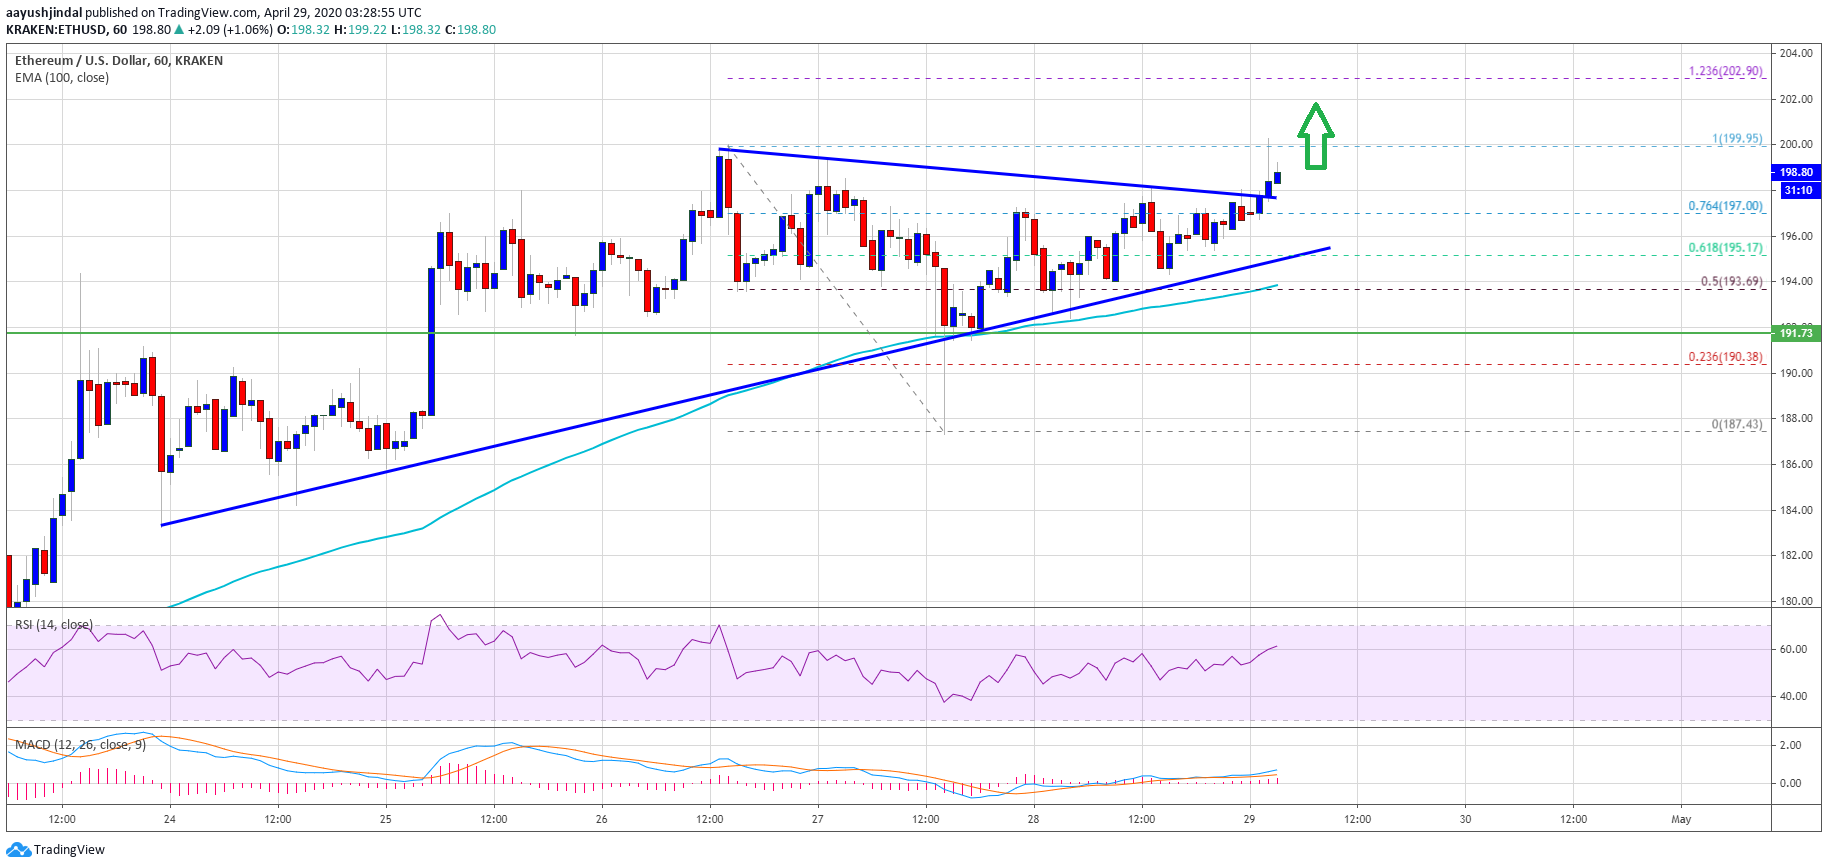
Ethereum is trading in a bullish zone above the $195 level against the US Dollar. ETH will most likely clear the $200 resistance for a run towards the $220 level.
- Ethereum is showing a lot of positive signs above the $195 support zone.
- The price is currently attempting an upside break above the $200 resistance area.
- There was a break above a major contracting triangle with resistance near $197 on the hourly chart of ETH/USD (data feed via Kraken).
- The pair could surge above the $200 barrier and test the next hurdle at $220.
Ethereum Price Likely to Rally Further
In the past few sessions, Ethereum price remained in a broad range above the $190 level against the US Dollar. ETH bears made a couple of attempts to push the price below the $190 and $188 support levels, but they failed.
The last swing low was formed near $188 before the price regained bullish momentum. It climbed back above the $190 level and the 100 hourly simple moving average. The bulls were able to clear the $195 hurdle for a trend reversal.
Moreover, there was a break above a major contracting triangle with resistance near $197 on the hourly chart of ETH/USD. The pair even surpassed the 76.4% Fib retracement level of the downward move from the $200 swing high to $188 low.
Ethereum is now trading near the $200 resistance and attempting an upside break. If the bulls gain strength, the price is likely to continue higher. An immediate resistance is near the $208 level since it is close to the 1.236 Fib extension level of the downward move from the $200 swing high to $188 low.
Any further gains above $208 could lead the price towards the next key resistance near the $220 level in the near term. An intermediate resistance for Ether may perhaps be $212.
Dips Supported
If Ethereum continues to struggle near the $200 resistance, there could be a downside correction. An initial support is near the $195 level and the triangle lower trend line.
The next major support is near the $193 level and the 100 hourly SMA. To start a substantial decline, the bears need a clear break below the $190 and $188 support levels.
Technical Indicators
Hourly MACD – The MACD for ETH/USD is currently gaining strength in the bullish zone.
Hourly RSI – The RSI for ETH/USD is now well above the 55 level.
Major Support Level – $193
Major Resistance Level – $200
Image from unsplash