Reason to trust

How Our News is Made
Strict editorial policy that focuses on accuracy, relevance, and impartiality
Ad discliamer
Morbi pretium leo et nisl aliquam mollis. Quisque arcu lorem, ultricies quis pellentesque nec, ullamcorper eu odio.
Bull and bears are constantly battling it out on cryptocurrency exchanges and trading platforms, hoping to push Bitcoin price higher or lower, and profit immensely from whatever trades they make or positions they take.
But their strategies can be easily clouded by their own bullish or bearish bias. Using just one trend line only across two different Bitcoin price charts on the monthly timeframe, it can demonstrate just how one’s own personal bias could influence how they interpret price action and any decisions they make based on their analysis.
How Personal Bias Can Influence Bitcoin Price Chart Analysis and Interpretation
Ask any trader worth their salt, and they’ll tell you that there are only a handful of strict rules to follow when trading in order to become successful. These rules include proper risk management strategies, a complete elimination of emotion, never investing more than you can comfortably afford to lose, and to remove any personal bias from the equation.
Related Reading | Bitcoin Weekly Candle Wicks Are Telling of Explosive Impulse Upward
Personal bias is among the worst mistakes traders make when performing technical analysis. If you are looking for bullish signals, they are likely going to appear in abundance. Searching for bearish signals will net similar results – especially when it comes to drawing trend lines or chart patterns.
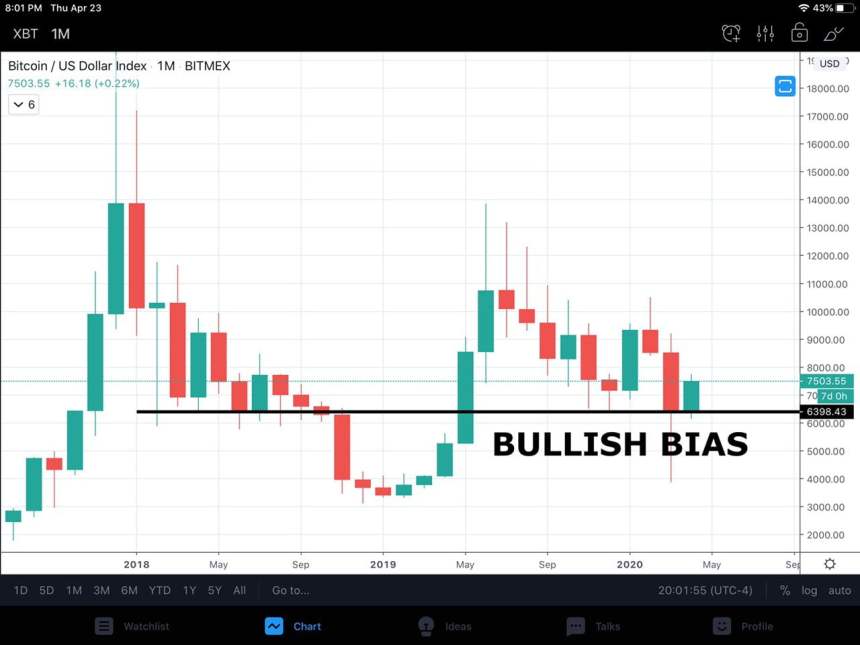
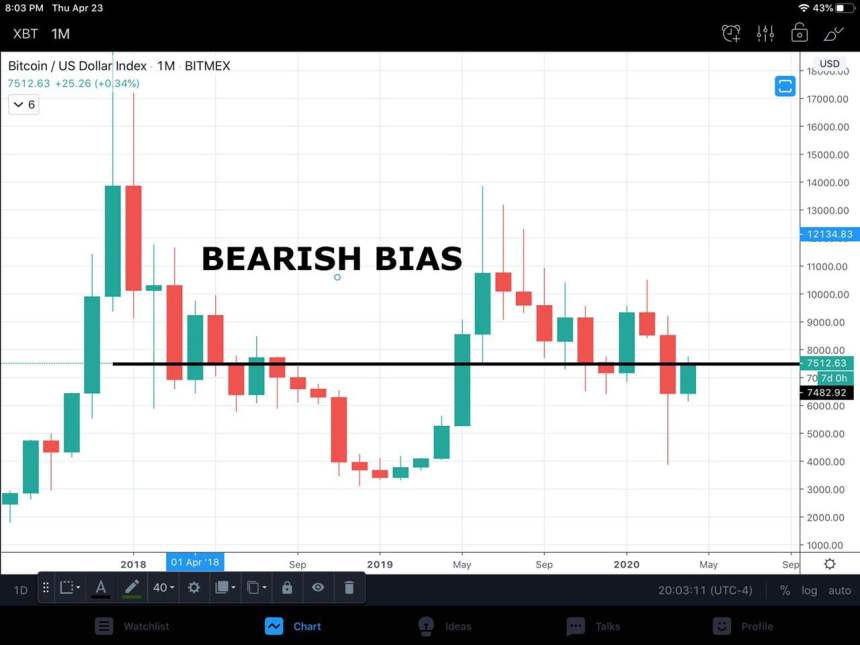
What may look bullish to one Bitcoin bull, could be a major sell signal for a bearish trader. Using the two below charts, it is easy to see how just one drawn trend line can separate a major bearish or bullish bias.

In the above chart, last month’s devastating sell candle held at support from the 2018 bear market, which ultimately broke down after repeated attempts.
Now, in the bearish bias version, the same line is moved upward by just over $1,000, and now the line is showing support turned resistance. But which actually is it?

Theoretically, either scenario is completely plausible, which is why technical analysts must remove any personal bias from any charting, strategizing, or planning they do.
Related Reading | Bitcoin Price Could Collapse to $2,000 Based On Golden Ratio
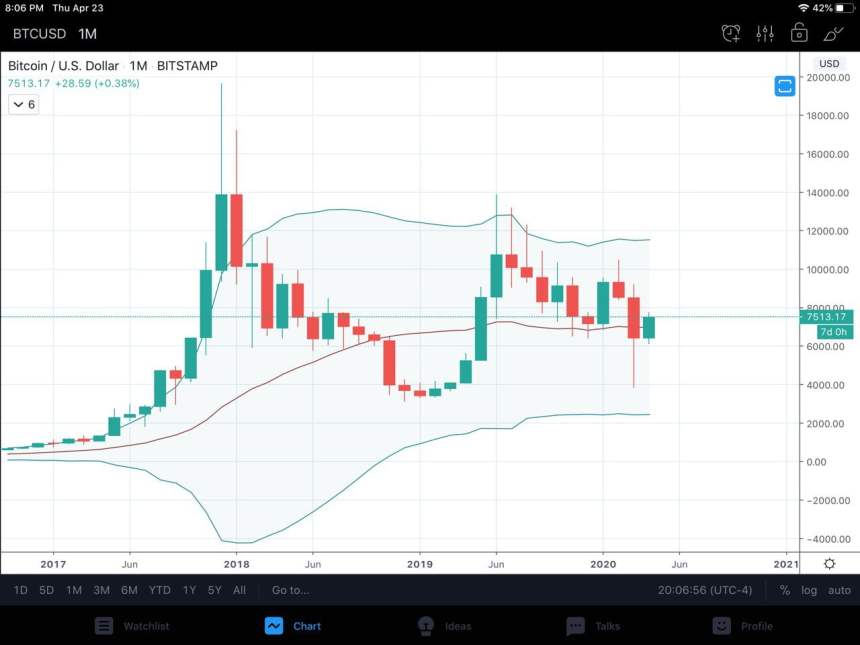
It is also why traders also rely on technical analysis indicators, to confirm signals and help to avoid bias from clouding judgment. Take the Bollinger Bands for example. on the same monthly price chart, with the trendlines removed, the Bollinger Bands could provide a better clue as to what may happen with Bitcoin next.

In the chart depicted with the Bollinger Bands, the March Bitcoin monthly sell candle closed below the mid-BB line, and is now trying to push back above it and reclaim it as support.
The indicator better supports the bearish bias. But even the indicator itself cannot confirm if the momentum is in favor of the bulls, and if the first-ever cryptocurrency explodes back above the mid-line much like it did in early 2019 or if it falls to the lowest part of the Bollinger Bands, currently residing around $2,000.
Featured image from Pixabay


