
Reason to trust
How Our News is Made
Strict editorial policy that focuses on accuracy, relevance, and impartiality
Ad discliamer
Morbi pretium leo et nisl aliquam mollis. Quisque arcu lorem, ultricies quis pellentesque nec, ullamcorper eu odio.
Bitcoin is up more than 5% and it broke the key $7,500 resistance against the US Dollar. BTC is now approaching a major hurdle near $8,000 and the 100-day simple moving average.
- Bitcoin is gaining bullish momentum above $7,000 and $7,200 against the US Dollar.
- The price is likely to face a strong resistance near $8,000 and the 100-day simple moving average.
- There was a break above a crucial bearish trend line with resistance near $7,040 on the daily chart of the BTC/USD pair (data feed from Kraken).
- The pair could either extend its rally above $8,000 to $9,000 or it might face rejection.
Bitcoin Price is Facing Huge Resistance
There was a slow and steady recovery in bitcoin from the $3,932 swing low against the US Dollar. BTC price broke many hurdles in the past few days and settled above the $6,000 resistance area.
The current upward move gained pace above the $6,500 and $7,000 resistance levels. There was also a break above the 50% Fib retracement level of the key decline from the $10,500 swing high to $3,921 swing low.
More importantly, there was a break above a crucial bearish trend line with resistance near $7,040 on the daily chart of the BTC/USD pair. The pair is now trading above the key $7,200 and $7,500 resistance levels.
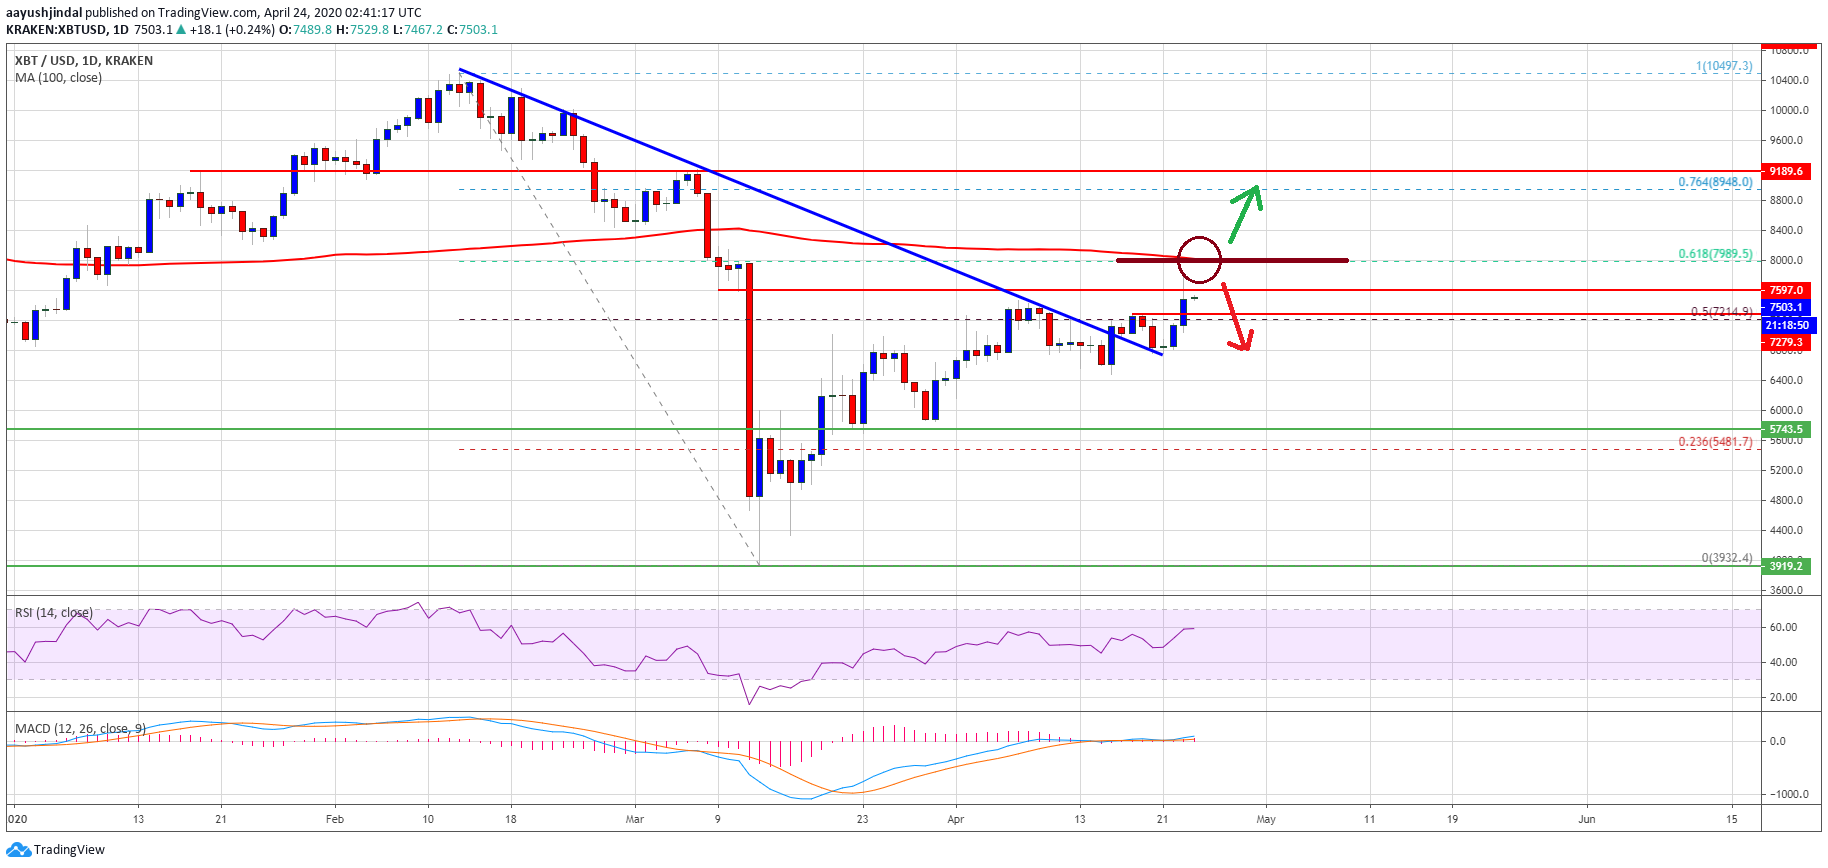
On the upside, there is a significant resistance waiting near the $8,000 level. The 100-day simple moving average is close to the $8,000 level to act as a resistance. The 61.8% Fib retracement level of the key decline from the $10,500 swing high to $3,921 swing low is also near $7,989.
A successful daily close above the $8,000 resistance and the 100-day SMA could open the doors for a larger rally. In the mentioned case, the price is likely to rise towards the $8,950 and $9,000 levels.
Fresh Decline?
If bitcoin price fails to continue above the $8,000 resistance or the 100-day SMA, it could start a fresh decline. An initial support on the downside is near the $7,200 level (the recent breakout zone).
A bearish break below the $7,200 support might lead the price towards the $6,800 support. Any further losses could initiate a drop towards the $6,200 support area in the coming days.
Technical indicators:
Daily MACD – The MACD is currently gaining momentum in the bullish zone.
Daily RSI (Relative Strength Index) – The RSI for BTC/USD is now well above the 50 level.
Major Support Levels – $7,200 followed by $6,200.
Major Resistance Levels – $8,000, $8,400 and $9,000.