Reason to trust

How Our News is Made
Strict editorial policy that focuses on accuracy, relevance, and impartiality
Ad discliamer
Morbi pretium leo et nisl aliquam mollis. Quisque arcu lorem, ultricies quis pellentesque nec, ullamcorper eu odio.
After experiencing a notable rally yesterday, Ethereum lost its momentum and retraced a significant amount of these gains, with the crypto plunging back to its recently established support at $180 as it flashes some signs of weakness.
It is important to note that bulls have established the price region just below where Ethereum is currently trading at as a major support zone, with the quantity of buy orders here leading some analysts to anticipate this level to spark its next rally.
This also comes as the crypto begins forming a bullish technical pattern that could help catalyze further momentum – should it post a clean breakout in the coming several days.
Ethereum Retraces from Daily Highs, but the Bull Case Remains Strong
At the time of writing, Ethereum is trading down just under 1% at its current price of $181, which marks a notable decline from daily highs of just over $190 that were set yesterday evening.
The overnight retrace from these highs came about in tandem with the decline seen by both Bitcoin and most other altcoins.
It also came shortly after ETH posted a significant outperformance of the aggregated crypto market, as ETH is still trading up from daily pre-rally lows of $172, while Bitcoin’s latest dip erased virtually all of its recent gains.
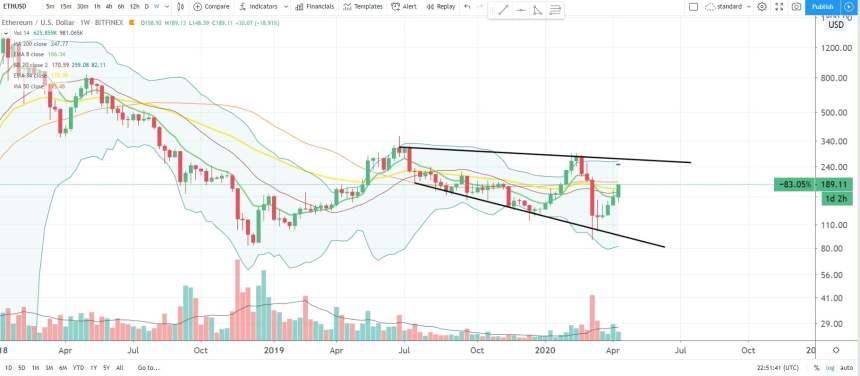
In the near-term, analysts are now watching to see how Ethereum reacts to a broadening descending wedge formation that could help provide it with further upwards momentum – should it post a clean breakout.
One popular pseudonymous analyst pointed to this emerging pattern in a recent tweet while referencing the cryptocurrency’s weekly chart.

Will Massive Support Be Enough to Spark ETH’s Next Explosive Rally?
This technical pattern isn’t the only thing currently counting in Ethereum’s favor.
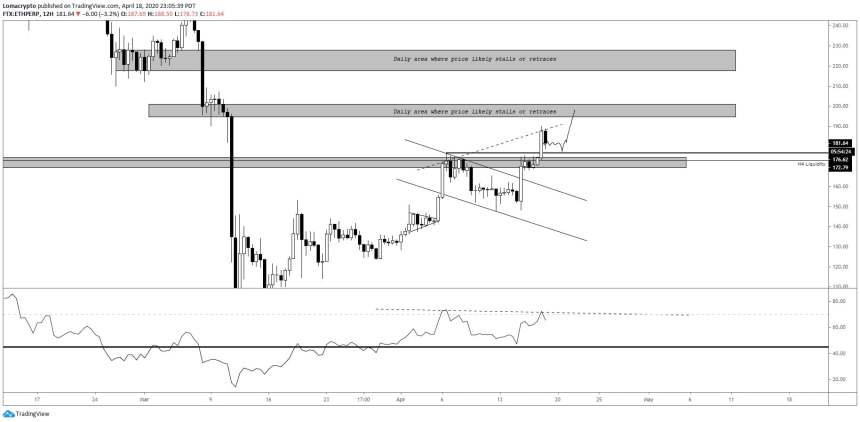
Another prominent analyst on Twitter recently explained that he has been accumulating positions in ETH throughout the past couple of days, with an average entry of $181.
“ETH: Most buys filled. Average entry: ~$181. H12 Divergence playing out right now. Hoping for $176 to get the last remainder filled to bring the average down to $178.”
He also offered a chart elucidating the support that has been established just beneath Ethereum’s current price level, with the two major low-time-frame resistance levels he is targeting sitting at roughly $200 and $230 respectively.

The eventual longevity of this uptrend could be determined by how it reacts to this support in the time prior to its weekly close that will occur in the next few hours.
Featured image from Unsplash.


