
Reason to trust
How Our News is Made
Strict editorial policy that focuses on accuracy, relevance, and impartiality
Ad discliamer
Morbi pretium leo et nisl aliquam mollis. Quisque arcu lorem, ultricies quis pellentesque nec, ullamcorper eu odio.
Ripple is currently recovering and trading above the $0.1850 level against the US Dollar. XRP price could start a strong rally if there is an upside break above $0.1900 and $0.1920.
- Ripple price is slowly rising and currently testing the $0.1900 resistance against the US dollar.
- There price is struggling to gain momentum above $0.1900, $0.1920, and the 100 hourly simple moving average.
- There is a major contracting triangle forming with resistance near $0.1890 on the hourly chart of the XRP/USD pair (data source from Kraken).
- The pair is likely to start a strong rally if it surpasses the $0.1900 and $0.1920 resistance levels.
Ripple Price Approaching Breakout
After testing the $0.1800-$0.1810 support area, ripple started an upside correction. XRP price corrected above the $0.1840 and $0.1850 resistance levels to move into a short term positive zone.
There was a close above the $0.1850 level and the 100 hourly simple moving average. However, the price seems to be facing a strong resistance near the $0.1890 and $0.1900 levels. The 50% Fib retracement level of the last key decline drop from the $0.1966 high to $0.1810 swing low is also acting as a hurdle.
Ripple price is also struggling to settle above the 100 hourly simple moving average (currently at $0.1880). More importantly, there is a major contracting triangle forming with resistance near $0.1890 on the hourly chart of the XRP/USD pair.
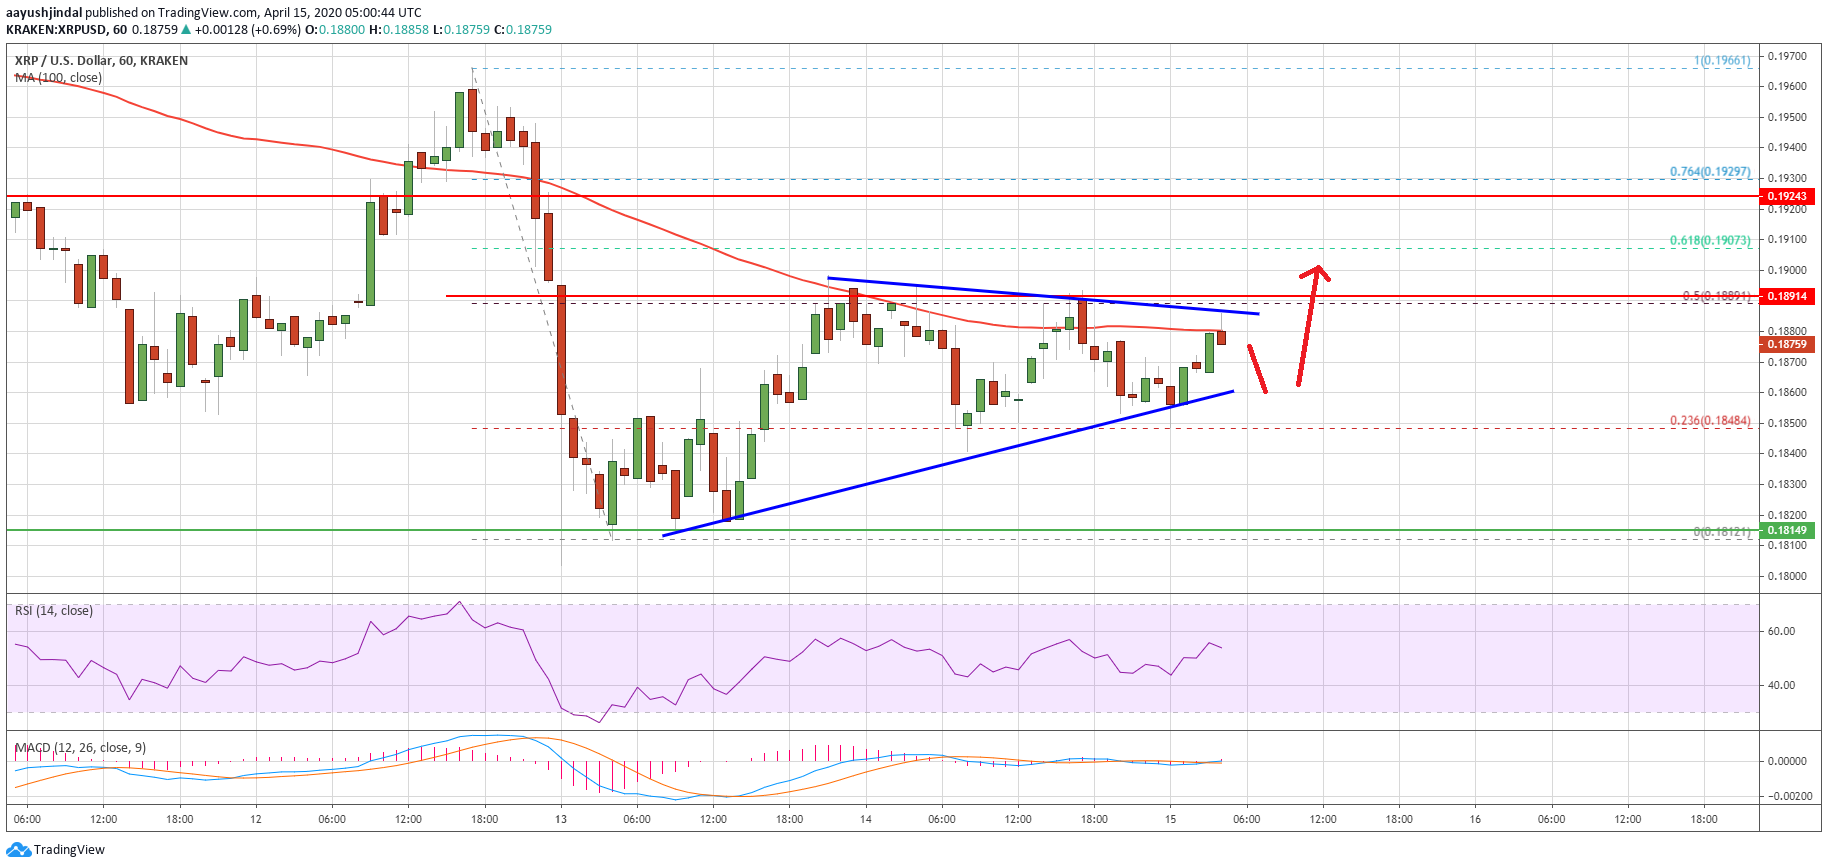
If the pair breaks the triangle resistance and $0.1900, it could test the 61.8% Fib retracement level of the last key decline drop from the $0.1966 high to $0.1810 swing low.
To start a strong upward move, the bulls need to surpass the $0.1920 resistance level. If they succeed, the price is likely to accelerate higher towards the $0.1980 and $0.2000 resistance levels in the near term.
Fresh Decline?
If ripple struggle to gain momentum above the 100 hourly SMA or the $0.1900 resistance, the price might start a fresh decline below the $0.1860 level.
An initial support on the downside is near a connecting bullish trend line at $0.1850. A clear break below the $0.1850 support level might start a substantial decline towards the $0.1810 and $0.1780 levels.
Technical Indicators
Hourly MACD – The MACD for XRP/USD is slowly moving in the bullish zone.
Hourly RSI (Relative Strength Index) – The RSI for XRP/USD is now just above the 50 level.
Major Support Levels – $0.1850, $0.1810 and $0.1800.
Major Resistance Levels – $0.1890, $0.1900 and $0.1920.
Take advantage of the trading opportunities with Plus500
Risk disclaimer: 76.4% of retail CFD accounts lose money.