
Reason to trust
How Our News is Made
Strict editorial policy that focuses on accuracy, relevance, and impartiality
Ad discliamer
Morbi pretium leo et nisl aliquam mollis. Quisque arcu lorem, ultricies quis pellentesque nec, ullamcorper eu odio.
Bitcoin is showing a few recovery signs above the $6,760 support against the US Dollar. However, BTC price is still trading below a key bearish trend line and $7,000.
- Bitcoin is currently correcting higher and trading above $6,800 against the US Dollar.
- The bulls are showing a lot of resilience above $6,600, but the price is still facing many hurdles.
- This week’s key bearish trend line is active with resistance near $7,040 on the hourly chart of the BTC/USD pair (data feed from Kraken).
- The pair must gain strength above $7,000 and $7,040 to continue higher in the near term.
Bitcoin Approaching Key Resistance
In the past three sessions, bitcoin bulls remained active above the $6,600 and $6,700 levels against the US Dollar. BTC price managed to settle above the $6,760 pivot zone and recently settled above the 100 hourly simple moving average.
There was a close above the 50% Fib retracement level of the main decline from the $7,218 swing high to $6,557 swing low. The price made an attempt to climb above the $6,950 and $7,000 resistance levels, but it failed.
It seems like the 61.8% Fib retracement level of the main decline from the $7,218 swing high to $6,557 swing low is acting as a strong resistance. More importantly, this week’s key bearish trend line is active with resistance near $7,040 on the hourly chart of the BTC/USD pair.
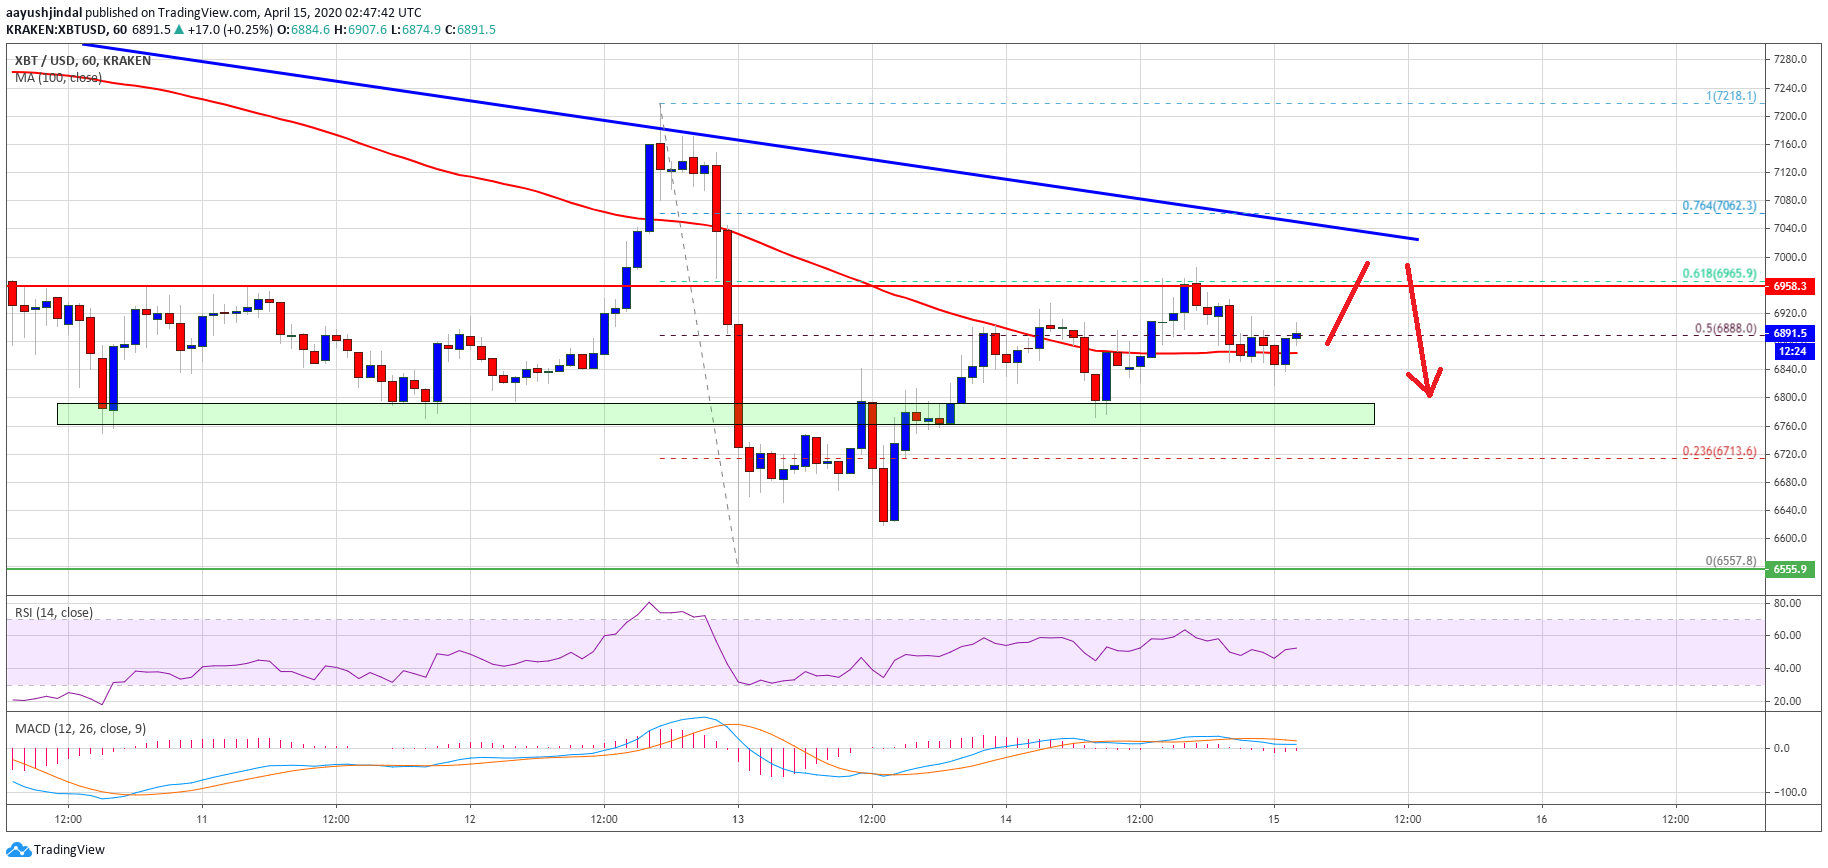
Bitcoin is clearly facing a couple of key hurdles near $6,950 and $7,040. A successful break above the trend line resistance could lead the price towards the main $7,200 resistance area.
If the bulls are able to clear the $7,200 resistance area, there are high chances of a strong rise in the coming sessions. The next major resistances are near $7,500 and $7,660.
Downside Reaction
If bitcoin struggles to clear the $6,950 and $7,040 resistance levels, there might be a bearish reaction. On the downside, an initial support is near the $6,750-$6,760 zone.
If the bulls fail to protect the $6,750-$6,760 support zone, the bears are likely to take control. In the mentioned bearish case, the price is likely to slide back towards the $6,560 zone in the near term. Any further losses may perhaps call for a test of the $6,200 level.
Technical indicators:
Hourly MACD – The MACD is slowly moving back into the bearish zone.
Hourly RSI (Relative Strength Index) – The RSI for BTC/USD is currently above the 50 level.
Major Support Levels – $6,760 followed by $6,560.
Major Resistance Levels – $6,950, $7,040 and $7,200.
Image from unsplash


