Reason to trust
How Our News is Made
Strict editorial policy that focuses on accuracy, relevance, and impartiality
Ad discliamer
Morbi pretium leo et nisl aliquam mollis. Quisque arcu lorem, ultricies quis pellentesque nec, ullamcorper eu odio.
Ethereum is down more than 10% from the $175 monthly high against the US Dollar and bitcoin. ETH price is still in a larger uptrend as long as it is above the $145 support.
- ETH price started a fresh decline after it failed to surpass $175 and $180 against the US Dollar.
- There was a break below the $162 support, but the price is still above the 100 simple moving average (4-hours).
- There is a key connecting bullish trend line forming with support near $155 on the 4-hours chart of ETH/USD (data feed via Kraken).
- The pair is likely to bounce back as long as it is above the $145 and $150 support levels.
Ethereum Price is Testing Major Support
This past week, Ethereum made a couple of attempts to gain strength above the $175 and $180 resistance levels against the US Dollar, but it failed. ETH price formed a new monthly high at $175 and recently started a fresh decline.
There was a break below the $165 and $162 support levels to enter a short term bearish zone. The price even traded below the 50% Fib retracement level of the upward move from the $141 swing low to $175 monthly high.
It is now trading below the $160 support, but holding the 100 simple moving average (4-hours). More importantly, there is a key connecting bullish trend line forming with support near $155 on the 4-hours chart of ETH/USD.
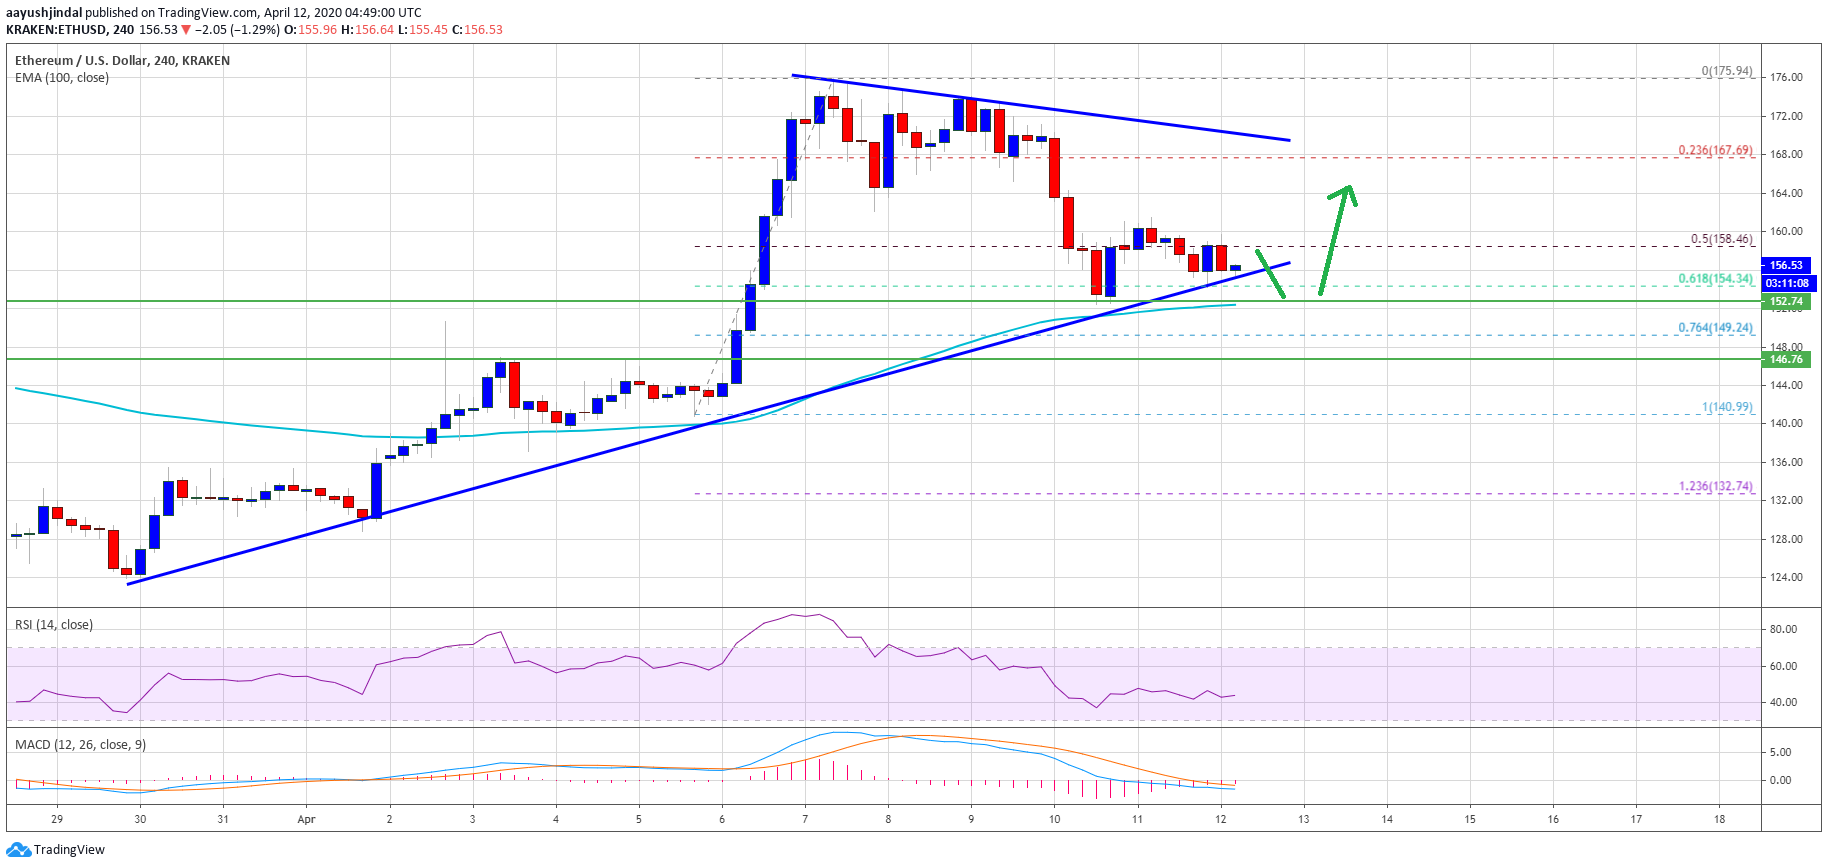
The 61.8% Fib retracement level of the upward move from the $141 swing low to $175 monthly high is also acting as a support. If there is a downside break below the $155 support, Ethereum price could decline further.
The next major uptrend support is near the $145 level (the previous breakout zone). If the bulls fail to keep the price above the $145 support, it could slide further towards the $132 support level.
Fresh Rally?
If Ethereum price remains well bid above the $145 support and the 100 simple moving average (4-hours), it could start a fresh increase. An immediate resistance is near the $162 level.
The first key resistance is near the $168 level and a connecting bearish trend line. A successful close above the $168 resistance is likely to push the price towards the $175 and $180 resistance levels.
Technical Indicators
4 hours MACD – The MACD for ETH/USD is about to move back into the bullish zone.
4 hours RSI – The RSI for ETH/USD is currently just above the 40 level.
Major Support Level – $145
Major Resistance Level – $168
Take advantage of the trading opportunities with Plus500
Risk disclaimer: 76.4% of retail CFD accounts lose money.