
Reason to trust
How Our News is Made
Strict editorial policy that focuses on accuracy, relevance, and impartiality
Ad discliamer
Morbi pretium leo et nisl aliquam mollis. Quisque arcu lorem, ultricies quis pellentesque nec, ullamcorper eu odio.
Ripple is struggling to clear the $0.2025 and $0.2050 resistance levels against the US Dollar. XRP price is currently correcting lower and it could extend its decline towards $0.1920 or $0.1880.
- Ripple price is showing a few bearish signs below the $0.2025 resistance against the US dollar.
- It seems like the bulls are struggling to clear the $0.2025 and $0.2050 resistance levels.
- There was a break below a key contracting triangle with support near $0.2000 on the hourly chart of the XRP/USD pair (data source from Kraken).
- The pair could continue to decline towards the $0.1920 support or $0.1880.
Ripple Price Could Correct Gains
In the past two days, ripple made a couple of attempts to clear the $0.2025 and $0.2050 resistance levels. However, XRP failed to gain strength above $0.2025 and remained in a range.
The recent high was formed near $0.2026 and the price is currently correcting lower. It broke the 23.6% Fib retracement level of the recent wave from the $0.1949 low to $0.2026 high.
There was also a break below a key contracting triangle with support near $0.2000 on the hourly chart of the XRP/USD pair. The pair is now showing a few bearish signs below the $0.2000 pivot level.
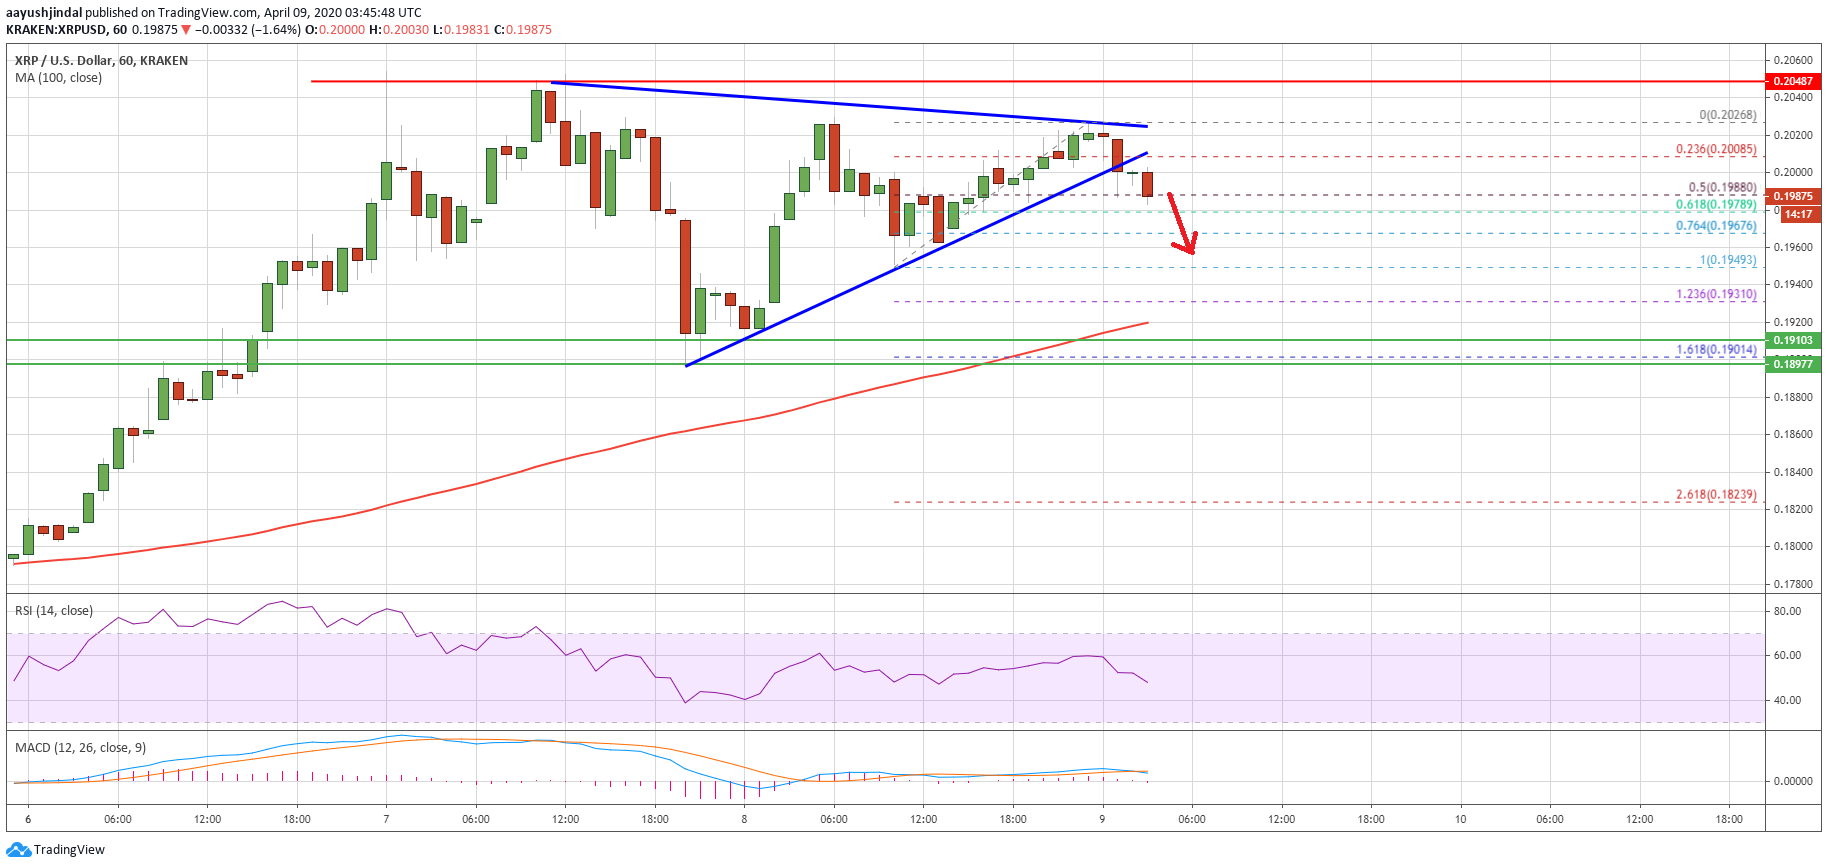
Ripple is currently testing the $0.1985 level or the 50% Fib retracement level of the recent wave from the $0.1949 low to $0.2026 high. If there is a downside break below the $0.1980 level, the price is likely to accelerate lower in the near term.
In the mentioned case, the price is likely to extend its decline towards the $0.1920 support area. The 100 hourly simple moving average is also waiting near the $0.1920 level to provide support. Any further losses may perhaps call for a test of the key $0.1880 support level.
Key Hurdles
On the upside, there are two major hurdles for ripple bulls near the $0.2025 and $0.2050 levels. To start a convincing rally, the price must gain bullish momentum above $0.2025 and then surpass $0.2050.
A successful close above the $0.2050 resistance area could open the doors for more upsides towards the $0.2100 and $0.2150 levels in the near term.
Technical Indicators
Hourly MACD – The MACD for XRP/USD is about to move into the bearish zone.
Hourly RSI (Relative Strength Index) – The RSI for XRP/USD is now just below the 50 level.
Major Support Levels – $0.1980, $0.1920 and $0.1880.
Major Resistance Levels – $0.2000, $0.2025 and $0.2050.
Take advantage of the trading opportunities with Plus500
Risk disclaimer: 76.4% of retail CFD accounts lose money.


