
Reason to trust
How Our News is Made
Strict editorial policy that focuses on accuracy, relevance, and impartiality
Ad discliamer
Morbi pretium leo et nisl aliquam mollis. Quisque arcu lorem, ultricies quis pellentesque nec, ullamcorper eu odio.
Ripple started a downside correction from the $0.2050 resistance against the US Dollar. XRP price tested the $0.1900 support area and it is currently rising towards $0.2000.
- Ripple price is trading nicely above the $0.1880 and $0.1900 support levels against the US dollar.
- A successful daily close above the $0.2000 barrier could start a larger rally.
- There is a key bearish trend line forming with resistance near $0.2000 on the hourly chart of the XRP/USD pair (data source from Kraken).
- The pair could continue to rise as long as it is above the $0.1880 support and pivot area.
Ripple Price Remains in The Green Zone
Yesterday, there was a strong rise in ripple above the $0.1880 and $0.1950 resistance levels. XRP even broke the key $0.2000 resistance area, but it failed to settle above the $0.2025 resistance area.
There were two attempts by the bulls to clear the $0.2050 barrier, but they failed. As a result, there was a downside correction from the $0.2055 swing high. The price traded below the $0.2000 support area, but it remained well above the 100 hourly simple moving average.
There was a break below the 23.6% Fib retracement level of the upward move from the $0.1765 swing low to $0.2055 monthly high. However, the $0.1900 support area acted as a strong buy zone for the bulls.
The 50% Fib retracement level of the upward move from the $0.1765 swing low to $0.2055 monthly high also provided support. Ripple is now rising again and trading above the $0.1950 level.
On the upside, there is a major hurdle forming near the $0.2000 level. There is also a key bearish trend line forming with resistance near $0.2000 on the hourly chart of the XRP/USD pair.
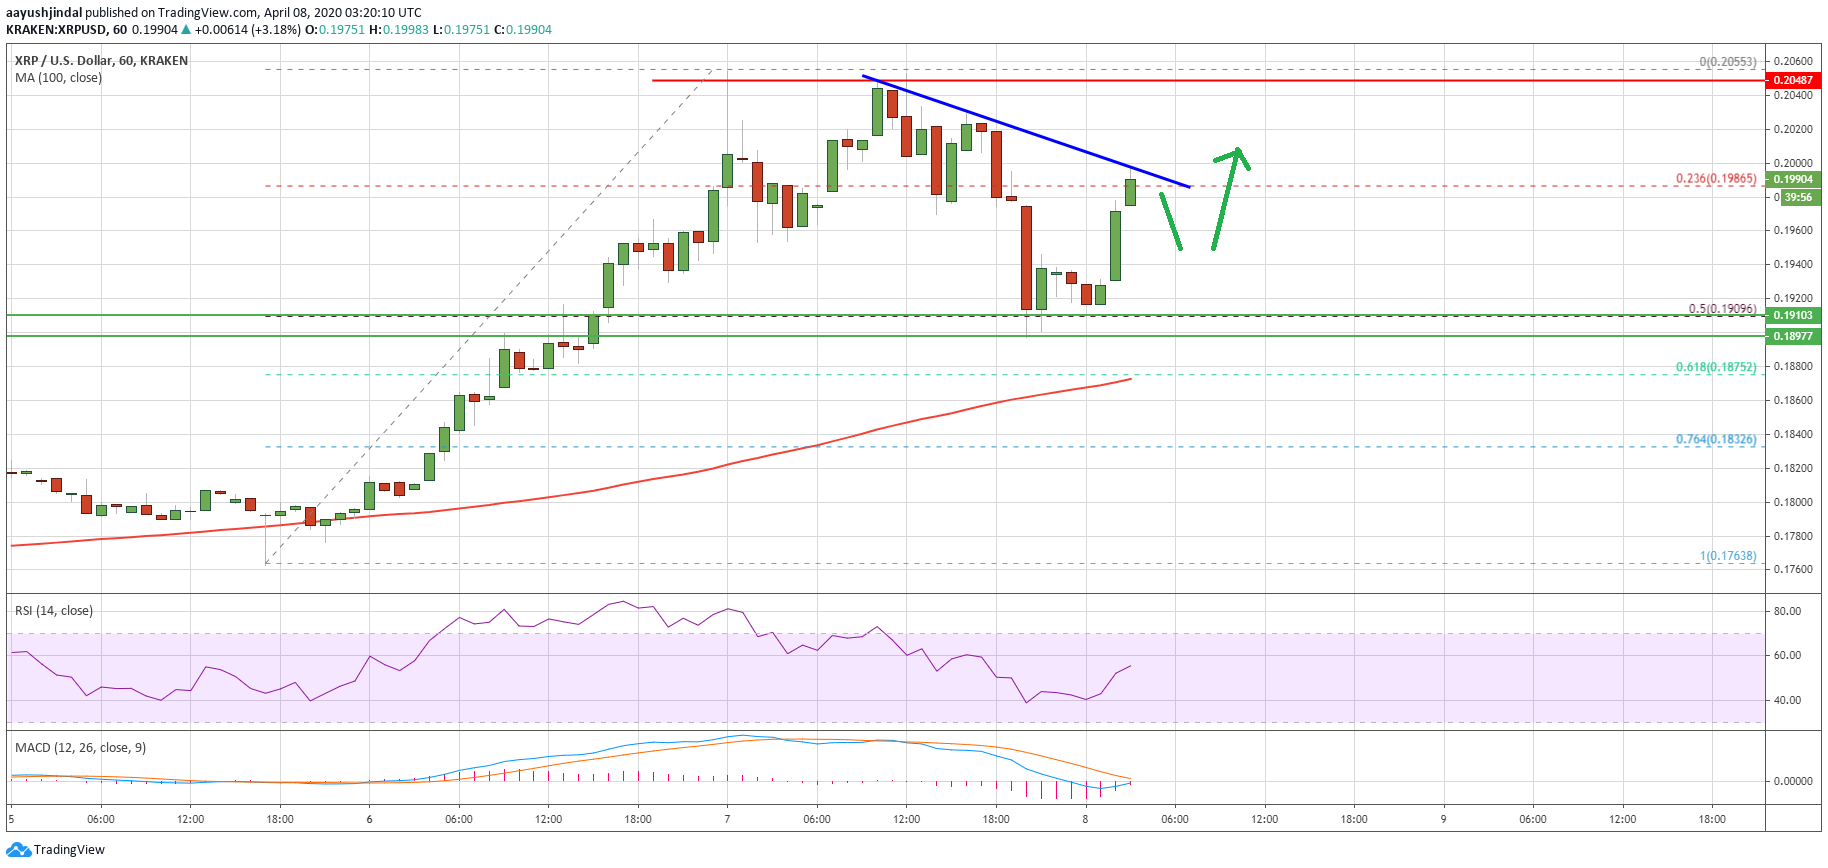
A successful daily close above the $0.2000 barrier could start a larger rally. The next hurdle is near $0.2050, above which the bulls are likely to aim $0.2120 and $0.2150.
Dips Remain Supported
If ripple struggles to continue above the $0.2000 resistance, it could correct lower. An initial support is near the $0.1920 level. The main support zone is near the $0.1900 and $0.1880 levels.
The 100 hourly SMA is also near the $0.1880 level to provide support. If there is a daily close below the $0.1880 support, the price could extend its decline in the near term.
Technical Indicators
Hourly MACD – The MACD for XRP/USD is about to move back into the bullish zone.
Hourly RSI (Relative Strength Index) – The RSI for XRP/USD is now back above the 50 level.
Major Support Levels – $0.1920, $0.1900 and $0.1880.
Major Resistance Levels – $0.2000, $0.2025 and $0.2050.
Take advantage of the trading opportunities with Plus500
Risk disclaimer: 76.4% of retail CFD accounts lose money.


