
Reason to trust
How Our News is Made
Strict editorial policy that focuses on accuracy, relevance, and impartiality
Ad discliamer
Morbi pretium leo et nisl aliquam mollis. Quisque arcu lorem, ultricies quis pellentesque nec, ullamcorper eu odio.
Bitcoin is up close to 5% and it broke the $7,000 resistance area against the US Dollar. It seems like BTC bulls are now aiming a test of $8,000 or the 100-day simple moving average.
- Bitcoin is gaining traction and it recently surpassed the $7,000 barrier against the US Dollar.
- The price is up more than 80% from the 2020 low of $3,932.
- There is a key bearish trend line forming with resistance near $7,880 on the daily chart of the BTC/USD pair (data feed from Kraken).
- The bulls are likely to aim a test of the $8,000 resistance or the 100-day simple moving average.
Bitcoin Price is Gaining Bullish Momentum
Yesterday, we discussed why a break above the $7,000 resistance is looming for bitcoin against the US Dollar. BTC price did gain traction and was able to surpass the $6,980 and $7,000 resistance levels.
It seems like the bulls were able to gain control after the price tumbled to a new yearly low of $3,932 in March 2020. The price climbed higher nicely above the 23.6% Fib retracement level of the last main decline from the $10,537 high to $3,932 low.
Bitcoin is now trading nicely above the $6,500 and $7,000 resistance levels. It is testing the 50% Fib retracement level of the last main decline from the $10,537 high to $3,932 low.
On the upside, there is a significant resistance waiting near the $8,000 level and the 100-day simple moving average. There is also a key bearish trend line forming with resistance near $7,880 on the daily chart of the BTC/USD pair.
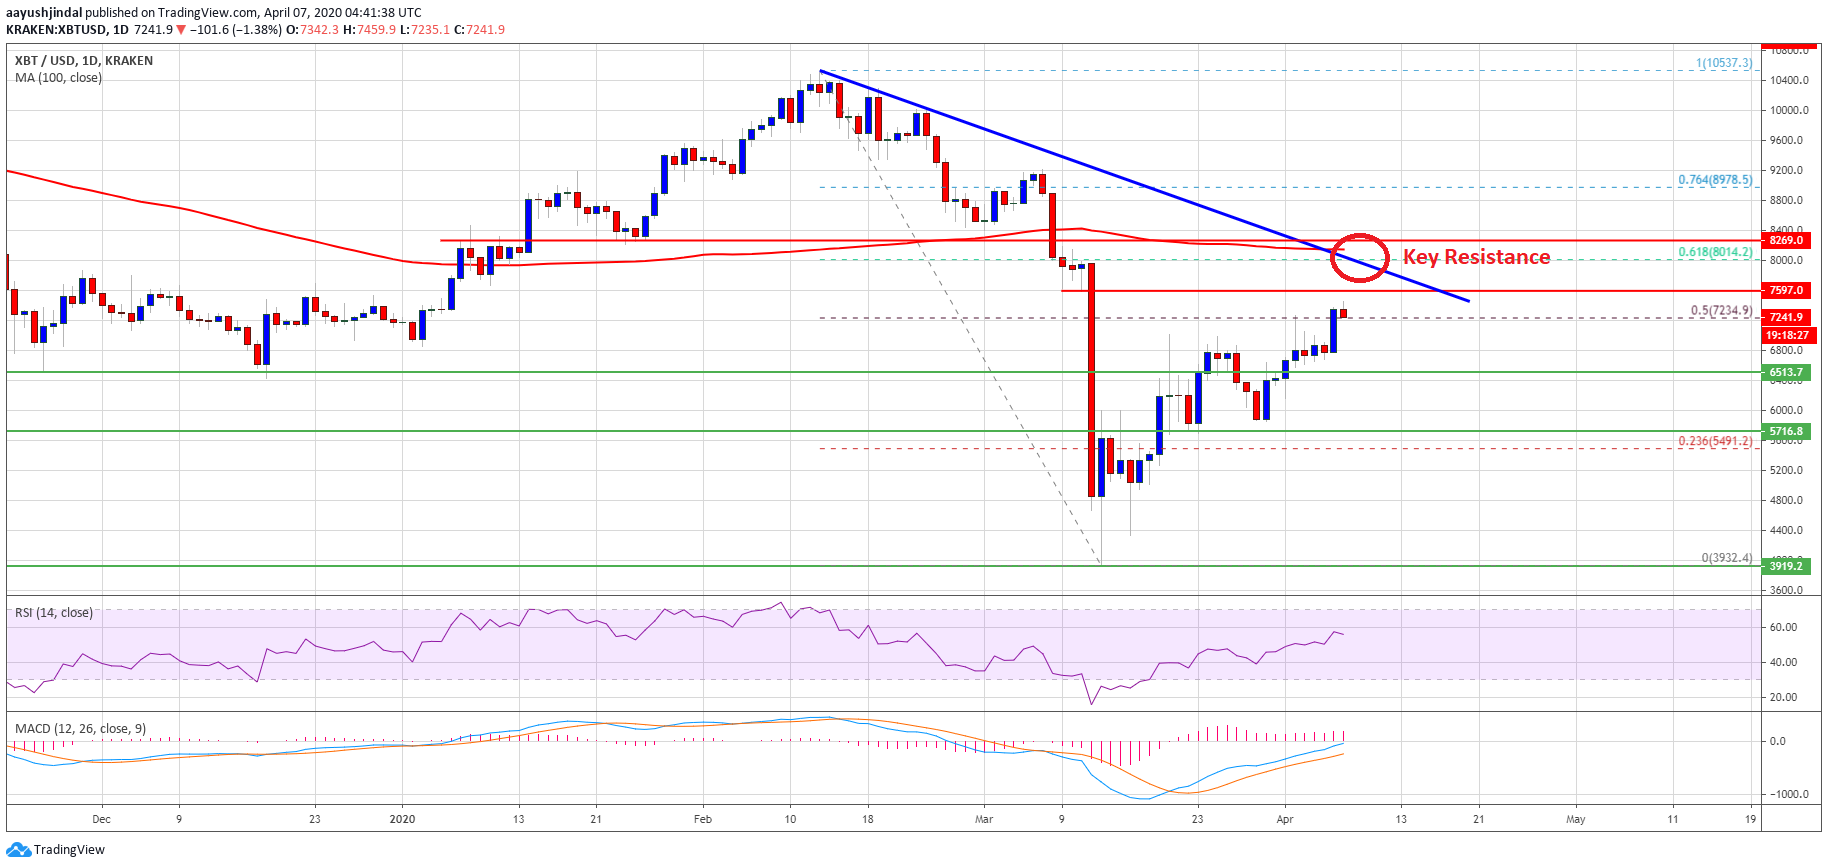
If the bulls are able to clear the $8,000 resistance and the 100-day SMA, it could start a medium term uptrend. The next key resistance is near the $8,800 and $9,000 levels, above which BTC might surge towards the $9,500 level.
Failure Near $8,000?
There are also high chances of bitcoin failing near the $8,000 resistance area. If there is a rejection near $8,000 or $7,880, the price could start a downside correction.
An initial support is near the $6,800 level (the recent breakout zone). The main support is now near the $6,500 level, where the bulls are likely to take a stand. Any further losses may perhaps lead the price towards $5,500.
Technical indicators:
Daily MACD – The MACD is now moving nicely in the bullish zone.
Daily RSI (Relative Strength Index) – The RSI for BTC/USD is now well above the 50 level.
Major Support Levels – $6,800 followed by $6,500.
Major Resistance Levels – $7,500, $7,880 and $8,000.