Reason to trust
How Our News is Made
Strict editorial policy that focuses on accuracy, relevance, and impartiality
Ad discliamer
Morbi pretium leo et nisl aliquam mollis. Quisque arcu lorem, ultricies quis pellentesque nec, ullamcorper eu odio.
Ripple is following a nice uptrend and trading above the $0.1750 support against the US Dollar. XRP price is likely to rally significantly if it clears the $0.1870 resistance.
- Ripple price is slowly gaining bullish momentum above the $0.1800 level against the US dollar.
- The price is facing a strong barrier near the $0.1870 and $0.1880 levels.
- There is a major bullish trend line forming with support near $0.1770 on the 4-hours chart of the XRP/USD pair (data source from Kraken).
- The bulls are likely to aim a test of $0.2000 or $0.2020 as long as the price is above 0.1700.
Ripple Price Forming Uptrend
After forming a support base above $0.1620, ripple started a slow and steady rise. XRP price broke the $0.1700 and $0.1720 resistance levels to move into a positive zone.
The price even climbed above the $0.1800 resistance and settled nicely above the 100 simple moving average (4-hours). However, the bulls faced a strong barrier near the $0.1870 and $0.1880 levels.
There were two attempts in the past 10 days to surpass the $0.1870 barrier, but the bulls failed to gain momentum. The recent high was formed near $0.1869 before ripple corrected lower.
It broke the $0.1820 level, plus the 23.6% Fib retracement level of the upward move from the $0.1675 low to $0.1869 high. On the downside, the $0.1780 and $0.1770 levels are currently providing support.
The 50% Fib retracement level of the upward move from the $0.1675 low to $0.1869 high is also acting as a support. More importantly, there is a major bullish trend line forming with support near $0.1770 on the 4-hours chart of the XRP/USD pair.
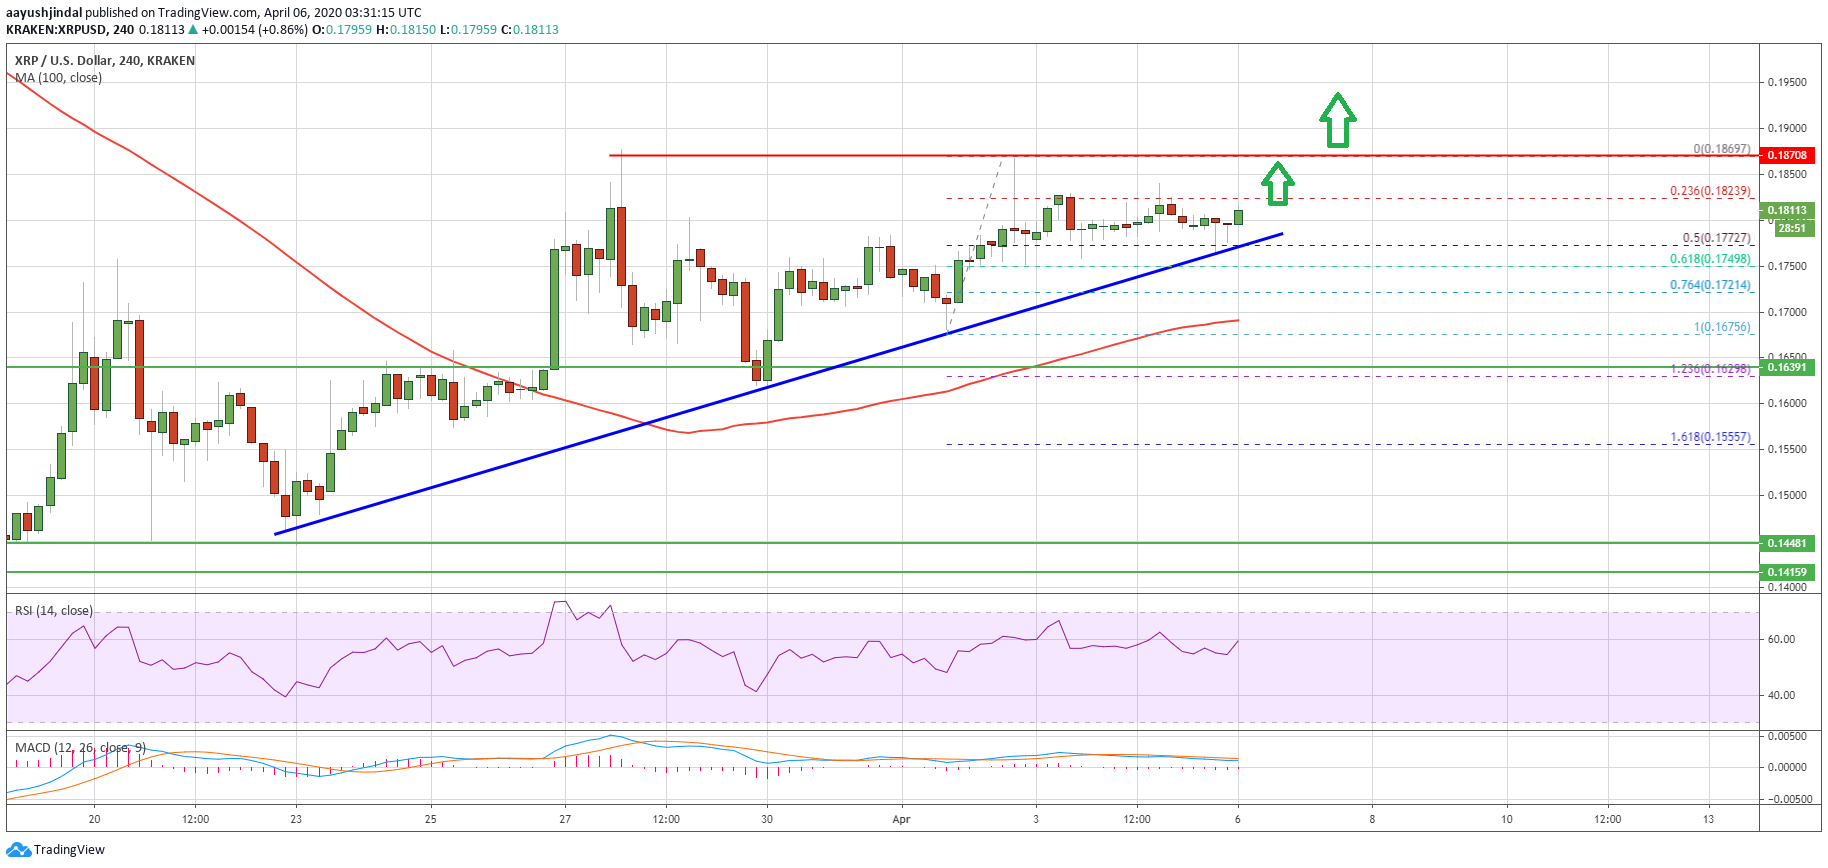
On the upside, ripple price must surpass the $0.1870 and $0.1880 resistance levels to start a strong increase. The next major resistance is near $0.2000, above which the price could even surpass $0.2020 in the near term.
Reversal Chances?
On the downside, there is a major support forming near $0.1770 and the trend line. If ripple breaks the trend line, it could extend its decline towards the $0.1720 support.
The main support is near the $0.1700 level and the 100 simple moving average (4-hours), below which the bulls are likely to lose control and there are high chances of a trend change to bearish.
Technical Indicators
4-Hours MACD – The MACD for XRP/USD is slowly gaining momentum in the bullish zone.
4-Hours RSI (Relative Strength Index) – The RSI for XRP/USD is currently rising towards the 60 level.
Major Support Levels – $0.1770, $0.1720 and $0.1650.
Major Resistance Levels – $0.1870, $0.1880 and $0.2000.
Take advantage of the trading opportunities with Plus500
Risk disclaimer: 76.4% of retail CFD accounts lose money.