Reason to trust
How Our News is Made
Strict editorial policy that focuses on accuracy, relevance, and impartiality
Ad discliamer
Morbi pretium leo et nisl aliquam mollis. Quisque arcu lorem, ultricies quis pellentesque nec, ullamcorper eu odio.
Bitcoin corrected lower from the $6,600 resistance area against the US Dollar. BTC price is currently holding the key $6,250 support and it could start a fresh increase in the near term.
- Bitcoin started a short term downside correction from the $6,636 high against the US Dollar.
- The price is currently holding the key $6,250 support and the 100 hourly SMA.
- There is likely a bullish flag pattern forming with resistance near $6,420 on the hourly chart of the BTC/USD pair (data feed from Kraken).
- The pair could either rally above $6,500 or it might start a fresh decline towards $5,850.
Bitcoin Could Rise Again
Yesterday, we discussed the chances of a short term correction in bitcoin from the $6,636 high against the US Dollar. BTC price did correct lower and traded below the $6,500 support area.
The bears were able to push the price below the 23.6% Fib retracement level of the upward move from the $5,850 swing low to $6,636 high. Besides, there was a break below the $6,400 level, but the price remained well bid above the 100 hourly simple moving average.
It seems like the bulls protected the 100 hourly SMA and the 50% Fib retracement level of the upward move from the $5,850 swing low to $6,636 high.
The price is currently rising and trading above $6,300. There is likely a bullish flag pattern forming with resistance near $6,420 on the hourly chart of the BTC/USD pair. If bitcoin surpasses the flag resistance and gains pace above the $6,450 level, there are high chances of a strong increase.
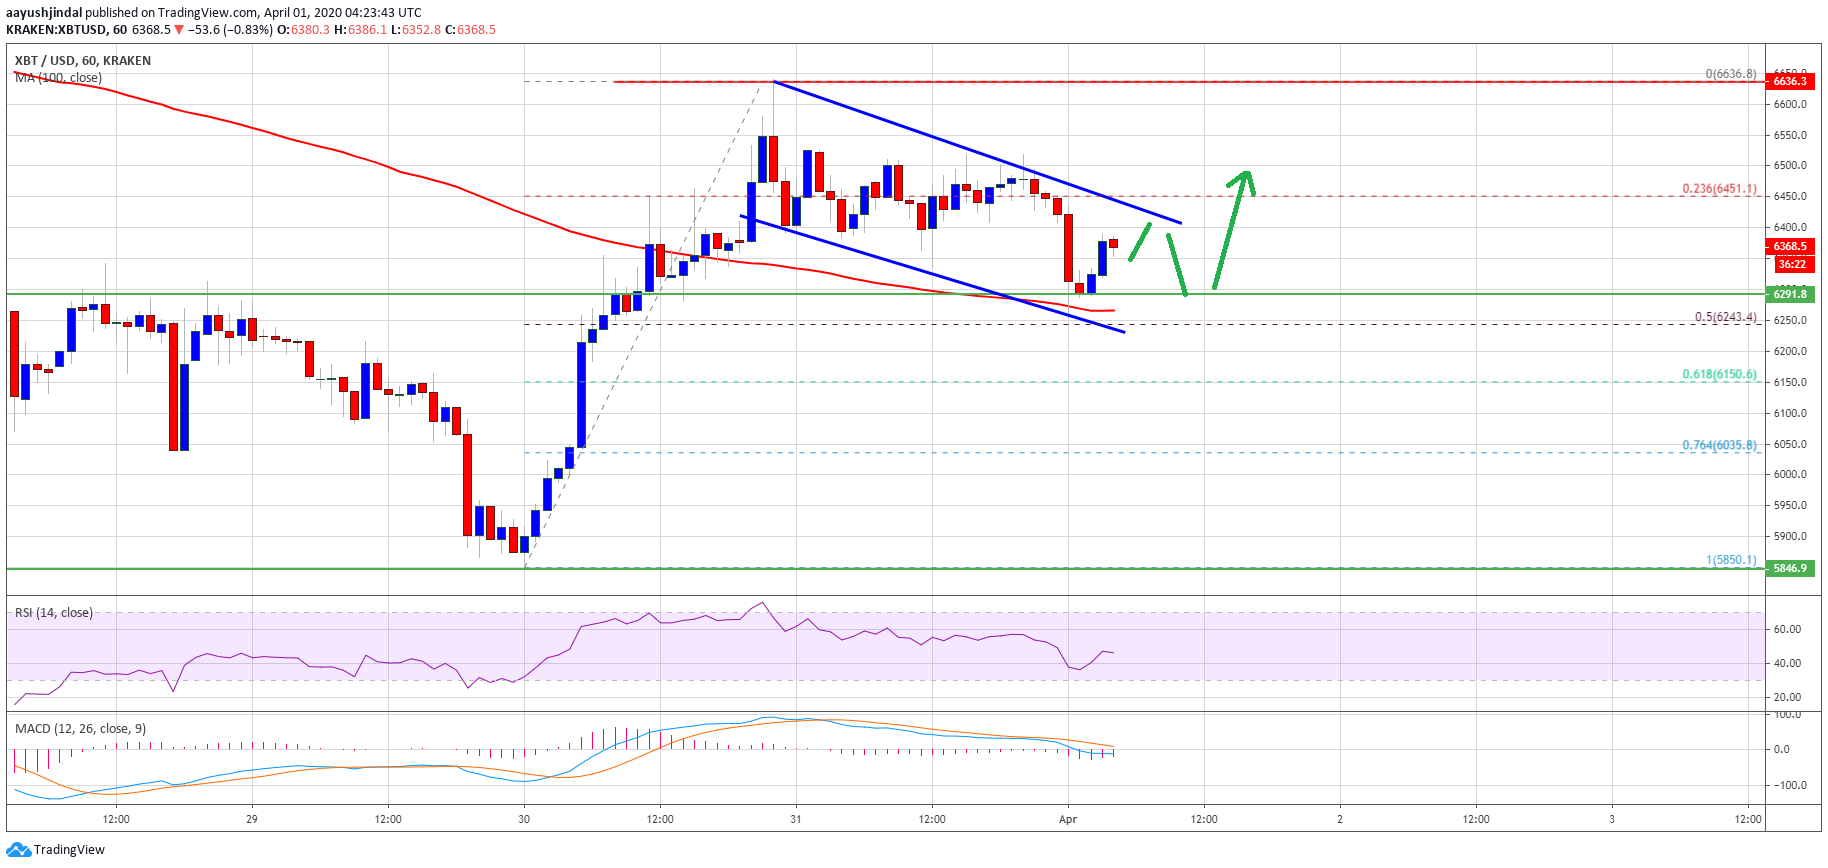
The next key resistance is near the $6,600 level, above which the price is likely to gain bullish momentum above $6,640. In the mentioned bullish case, the bulls are likely to aim a test of the $7,000 resistance.
Another Rejection?
If bitcoin fails to clear the flag resistance and $6,450, it could struggle to stay above the 100 hourly SMA. A bearish break below the 100 hourly SMA and the $6,250 support may perhaps extend losses.
The next support is near the $6,000 level, below which the bears are likely to aim a retest of the $5,850 support area in the near term.
Technical indicators:
Hourly MACD – The MACD is currently losing momentum in the bearish zone.
Hourly RSI (Relative Strength Index) – The RSI for BTC/USD is currently struggling to move back above the 50 level.
Major Support Levels – $6,250 followed by $6,000.
Major Resistance Levels – $6,450, $6,500 and $6,600.
Take advantage of the trading opportunities with Plus500
Risk disclaimer: 76.4% of retail CFD accounts lose money.