
Reason to trust
How Our News is Made
Strict editorial policy that focuses on accuracy, relevance, and impartiality
Ad discliamer
Morbi pretium leo et nisl aliquam mollis. Quisque arcu lorem, ultricies quis pellentesque nec, ullamcorper eu odio.
Ripple is up around 5% and it broke the $0.1700 resistance area against the US Dollar. XRP price is currently consolidating gains below the key $0.1750 resistance.
- Ripple price is showing a few positive signs above the $0.1650 support against the US dollar.
- The bulls are likely to gain strength if there is a break above the $0.1750 hurdle.
- There was a break above yesterday’s key bearish trend line with resistance near $0.1690 on the hourly chart of the XRP/USD pair (data source from Kraken).
- The pair might start a fresh decline if it fails to stay above the $0.1650 support area.
Ripple Price Consolidating Gains
After trading as low as $0.1620, ripple started a steady upward move. XRP price traded above the key $0.1650 and $0.1700 resistance levels to start a real recovery wave.
There was even a break above the $0.1720 resistance and the 100 hourly simple moving average. However, the bulls faced a strong resistance near the $0.1750 area. There was also a break above yesterday’s key bearish trend line with resistance near $0.1690 on the hourly chart of the XRP/USD pair.
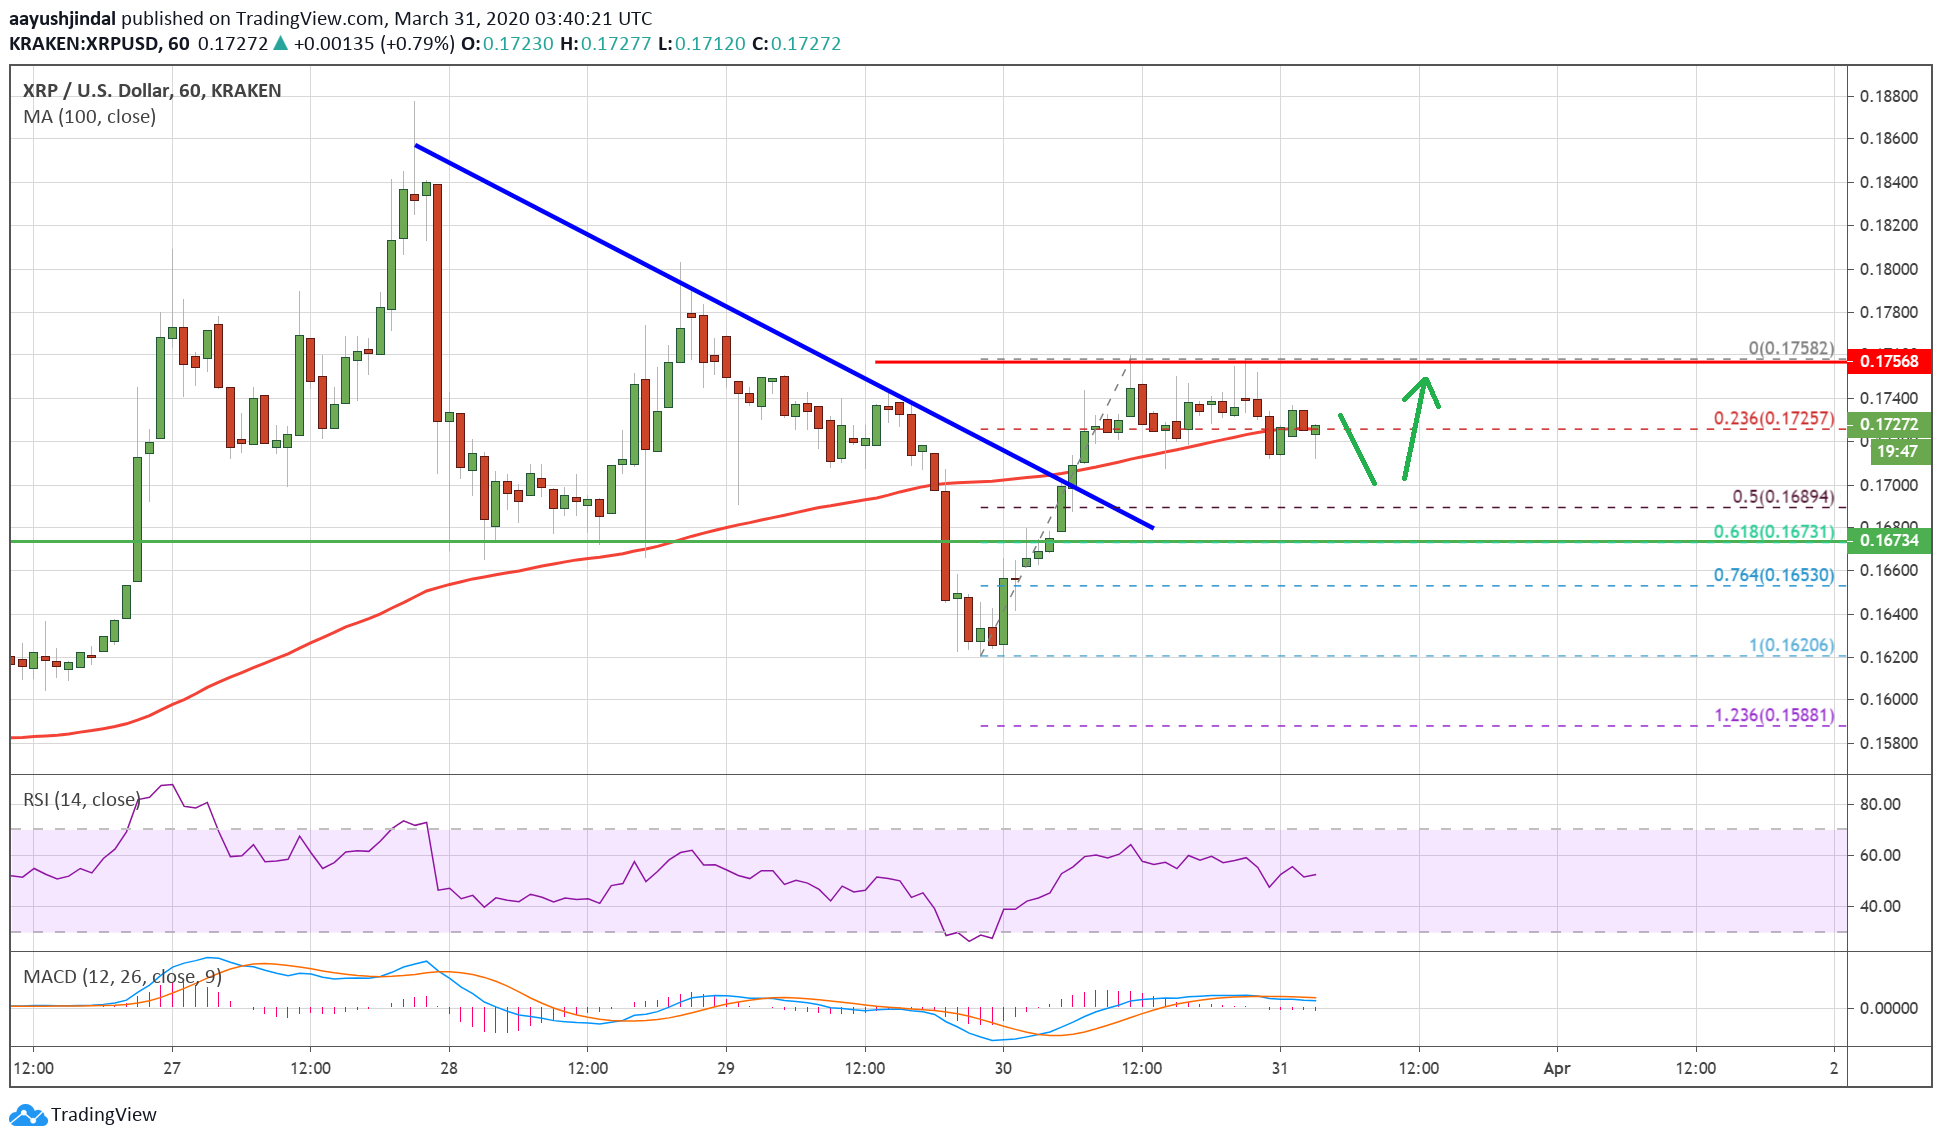
A high is formed near $0.1758 and the price is currently consolidating gains. It broke the 23.6% Fib retracement level of the recent wave from the $0.1620 low to $0.1758 high. Ripple is now trading near the $0.1720 area and the 100 hourly SMA.
An initial support is near the $0.1680 level. It is close to the 50% Fib retracement level of the recent wave from the $0.1620 low to $0.1758 high.
The main support is near the $0.1650 level, below which the bulls are likely to lose control. In the mentioned bearish case, the price is likely to accelerate lower towards the $0.1620 support. Any further losses may perhaps lead the price towards $0.1500.
More Upsides?
If ripple remains stable above the $0.1680 and $0.1650 support levels, there are chances of a decent increase. The first major resistance is near the $0.1750 level.
A clear break and close above the $0.1750 resistance could open the doors for more upsides. The next key resistance is near the $0.1850 and $0.1880 levels. Any further gains could start a strong rise towards the man $0.2000 resistance area.
Technical Indicators
Hourly MACD – The MACD for XRP/USD is slowly losing momentum in the bullish zone.
Hourly RSI (Relative Strength Index) – The RSI for XRP/USD is currently flat above the 50 level.
Major Support Levels – $0.1680, $0.1650 and $0.1620.
Major Resistance Levels – $0.1750, $0.1850 and $0.1880.
Take advantage of the trading opportunities with Plus500
Risk disclaimer: 76.4% of retail CFD accounts lose money.