
Reason to trust
How Our News is Made
Strict editorial policy that focuses on accuracy, relevance, and impartiality
Ad discliamer
Morbi pretium leo et nisl aliquam mollis. Quisque arcu lorem, ultricies quis pellentesque nec, ullamcorper eu odio.
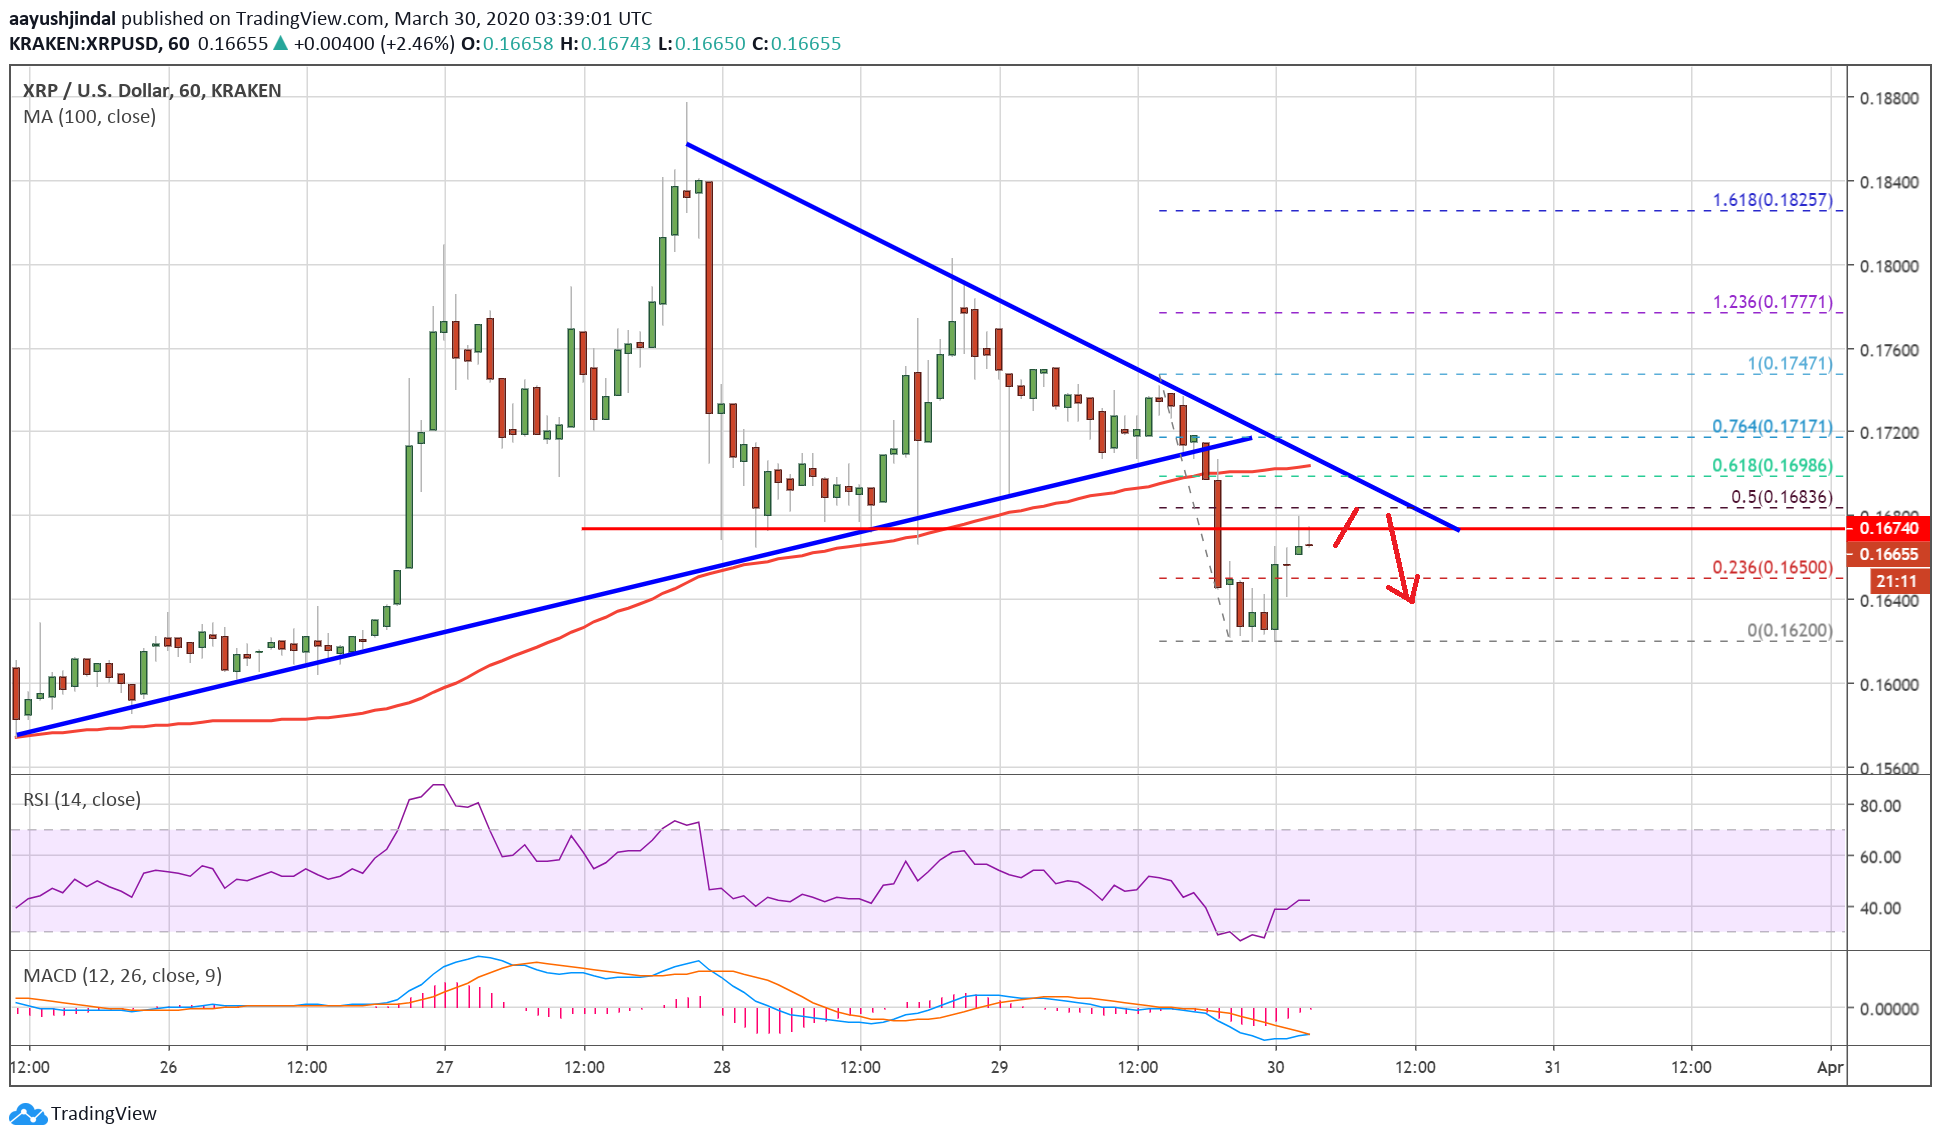
Ripple is down close to 5% and it broke the key $0.1680 support zone against the US Dollar. XRP price is currently correcting higher, but it is likely to face hurdles near $0.1700.
- Ripple price declined below the $0.1720 and $0.680 support levels against the US dollar.
- A low is formed near $0.1620 and the price is currently correcting higher.
- There is a key bearish trend line forming with resistance near $0.1685 on the hourly chart of the XRP/USD pair (data source from Kraken).
- The price is likely to face a lot of selling interest if it corrects towards $0.1680 or $0.1700.
Ripple Price Turns Red
In the past few days, ripple faced an increase in selling pressure from well above the $0.1750 zone. XRP price broke a couple of important supports near the $0.1720 level to move into a bearish zone.
The bears gained traction and they succeeded in gathering momentum below the $0.1680 level and the 100 hourly simple moving average. The price traded as low as $0.1620 and it is currently correcting higher.
There was a break above the 23.6% Fib retracement level of the recent decline from the $0.1747 high to $0.1620 low. Ripple is currently trading higher, but it is likely to face a lot of hurdles near $0.1680.
There is also a key bearish trend line forming with resistance near $0.1685 on the hourly chart of the XRP/USD pair. The 50% Fib retracement level of the recent decline from the $0.1747 high to $0.1620 low is also near the $0.1680 level to act as a major hurdle.
If there is an upside break above the $0.1680 resistance area, the price could test the $0.1700 barrier and the 100 hourly SMA. A clear break above the 100 hourly SMA is needed for a push towards $0.1750 in the near term.
More Downsides?
If ripple fails to recover above the $0.1680 and $0.1700 resistance levels, there are chances of more downsides in the near term. The main support is near the $0.1620 level, below which the bears are likely to aim the $0.1580 zone.
Any further losses may perhaps lead the price towards the $0.1550 support area in the near term.
Technical Indicators
Hourly MACD – The MACD for XRP/USD is slowly moving back into the bullish zone.
Hourly RSI (Relative Strength Index) – The RSI for XRP/USD is currently recovering and moving towards the 50 level.
Major Support Levels – $0.1620, $0.1600 and $0.1580.
Major Resistance Levels – $0.1680, $0.1700 and $0.1720.
Take advantage of the trading opportunities with Plus500
Risk disclaimer: 76.4% of retail CFD accounts lose money.