
Reason to trust
How Our News is Made
Strict editorial policy that focuses on accuracy, relevance, and impartiality
Ad discliamer
Morbi pretium leo et nisl aliquam mollis. Quisque arcu lorem, ultricies quis pellentesque nec, ullamcorper eu odio.
Ripple is up around 10% and it broke the key $0.1650 resistance zone against the US Dollar. XRP price remains in a nice uptrend and it could continue to rise towards $0.2000.
- Ripple price started a strong rise above the $0.1640 and $0.1650 resistance levels against the US dollar.
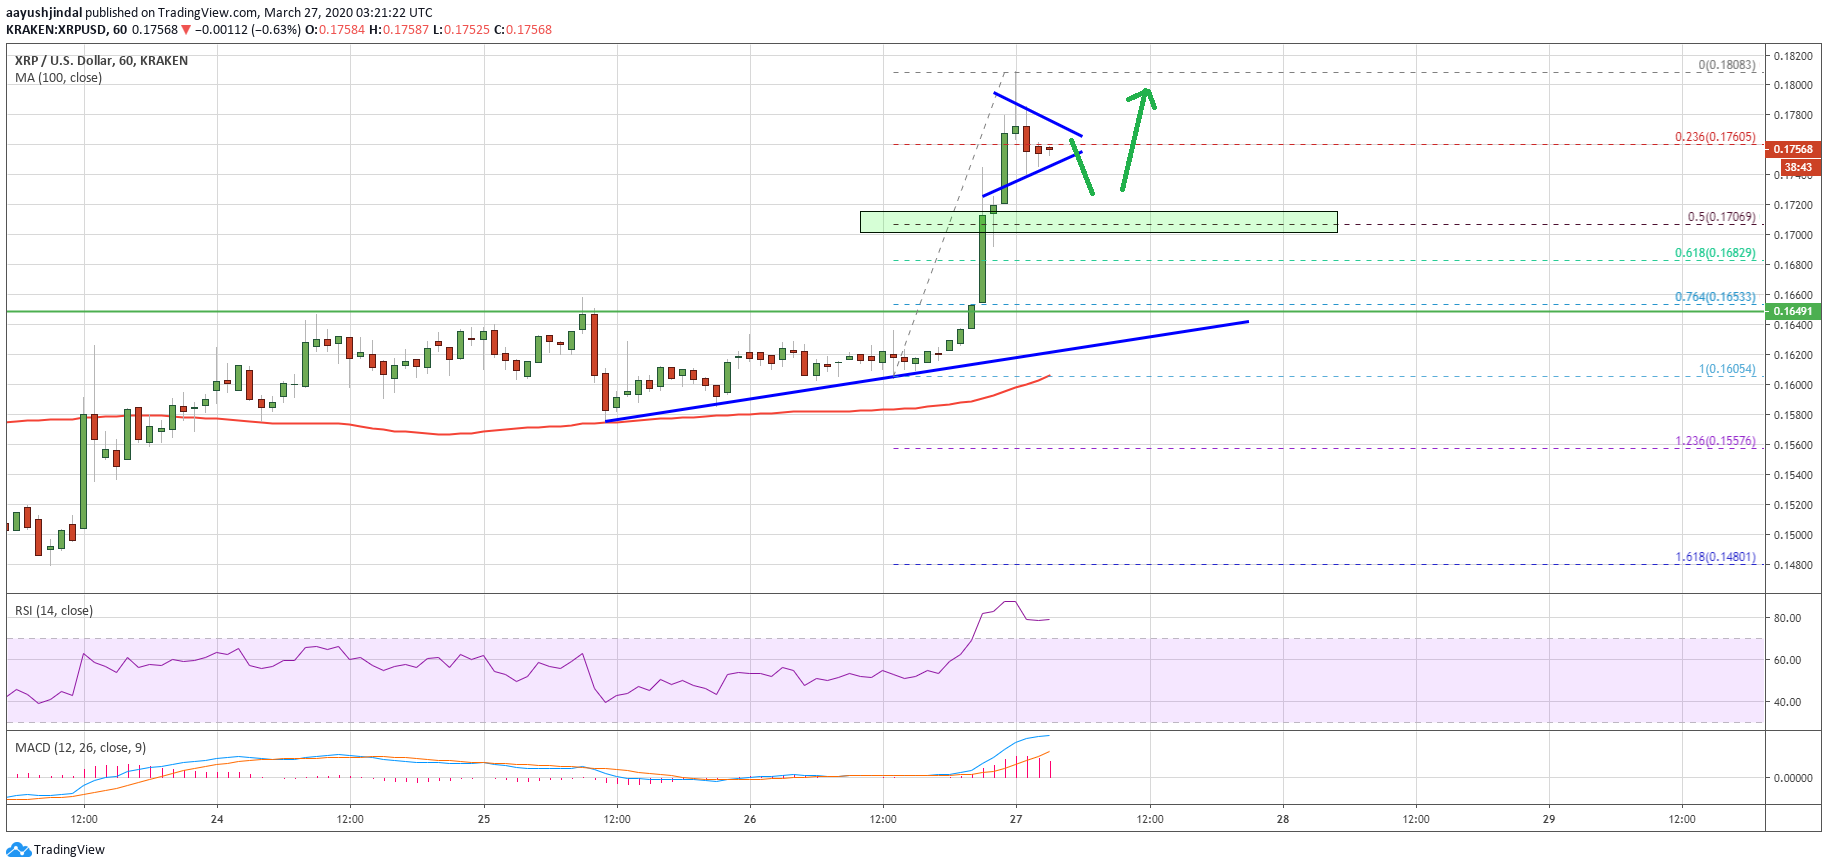
- The bulls were able to push the price above $0.1750 and a high was formed near $0.1808.
- There is a short term contracting triangle forming with resistance near $0.1780 on the hourly chart of the XRP/USD pair (data source from Kraken).
- The price could correct a few points in the near term, but dips remain supported near $0.1700.
Ripple Price is Surging
Yesterday, we discussed the chances of a strong rally in ripple above the $0.1640 and $0.1650 resistance levels. XRP price did break the $0.1650 resistance area to start a solid upward move.
It broke the $0.1720 resistance and settled nicely above the 100 hourly simple moving average. The upward move gained pace above the $0.1750 level and the price traded to a new weekly high at $0.1808.
The price is currently correcting lower and trading below $0.1780. There was a break below the 23.6% Fib retracement level of the upward move from the $0.1605 low to $0.1808 high.
It seems like there is a short term contracting triangle forming with resistance near $0.1780 on the hourly chart of the XRP/USD pair. If there is an upside break, ripple price is likely to continue higher above the $0.1800 resistance area.
In the stated case, the price is likely to surge above the $0.1808 high and $0.1820. The next major resistance is near the $0.1880 level, above which the bulls are likely to aim a test of the $0.2000 barrier in the near term.
Downside Correction?
If ripple fails to continue above the $0.1780 and $0.1800 resistance levels, it could start a downside correction. The first major support is near the $0.1705 area. It is close to the 50% Fib retracement level of the upward move from the $0.1605 low to $0.1808 high.
The next major support is near the $0.1650 area (the recent breakout resistance), where the bulls are likely to take a strong stand.
Technical Indicators
Hourly MACD – The MACD for XRP/USD is now gaining momentum in the bullish zone.
Hourly RSI (Relative Strength Index) – The RSI for XRP/USD is currently well above the 70 level and it is in the overbought zone.
Major Support Levels – $0.1750, $0.1705 and $0.1650.
Major Resistance Levels – $0.1780, $0.1800 and $0.1850.
Take advantage of the trading opportunities with Plus500
Risk disclaimer: 76.4% of retail CFD accounts lose money.