
Reason to trust
How Our News is Made
Strict editorial policy that focuses on accuracy, relevance, and impartiality
Ad discliamer
Morbi pretium leo et nisl aliquam mollis. Quisque arcu lorem, ultricies quis pellentesque nec, ullamcorper eu odio.
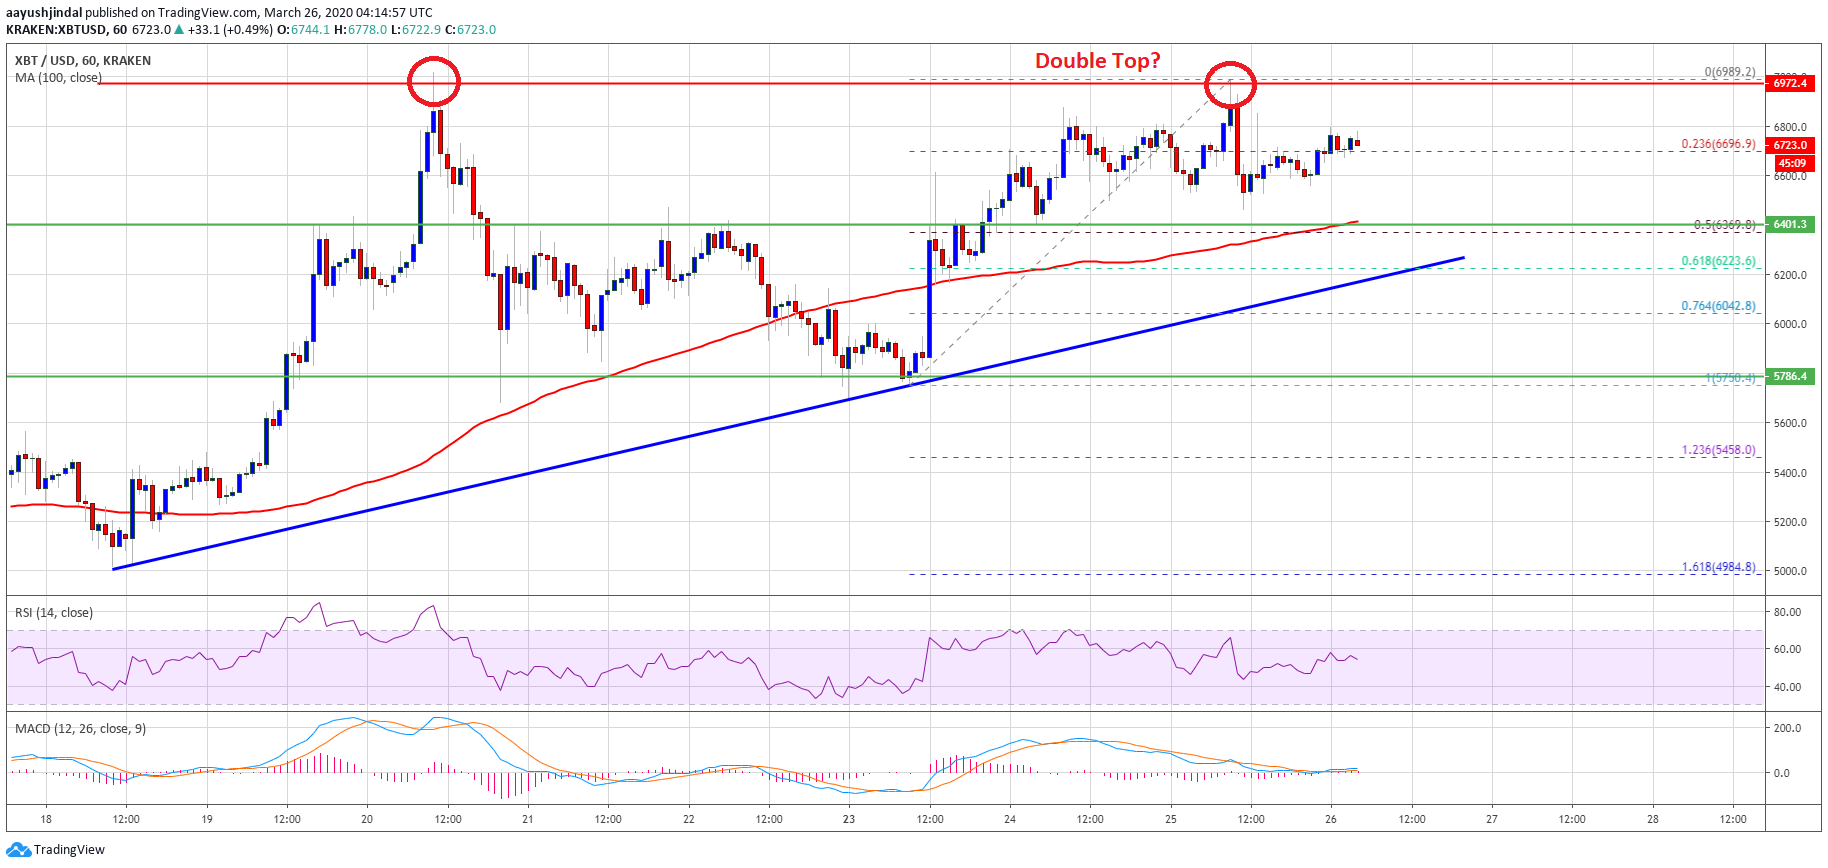
Bitcoin is facing a strong resistance near the $7,000 level against the US Dollar. BTC price is likely forming a double top pattern near the $7,000 level and it could dive below $6,400.
- Bitcoin is forming a bearish breakdown structure below $7,000 against the US Dollar.
- A double top pattern is forming with resistance near $7,000 and support at $6,400.
- There is a crucial bullish trend line forming with support near $6,240 on the hourly chart of the BTC/USD pair (data feed from Kraken).
- The pair either rally significantly above $7,000 or it might dive towards the $6,000 level.
Bitcoin Facing Hurdles
In the past few sessions, bitcoin remained well bid above the $6,400 support area against the US Dollar. BTC price even climbed above the $6,800 resistance and settled above the 100 hourly simple moving average.
However, the bulls seem to be struggling near the $7,000 resistance area. There is likely a double top pattern forming with resistance near $7,000. The last swing high was formed near $6,989 before the price corrected lower.
There was a break below the 23.6% Fib retracement level of the main rise from the $5,750 swing low to $6,989 high. On the downside, the $6,500 area is acting as a strong support.
The main neckline support for bitcoin is near the $6,400 level and the 100 hourly simple moving average. It is also close to the 50% Fib retracement level of the main rise from the $5,750 swing low to $6,989 high.
If there is a downside break below the $6,400 support and the 100 hourly SMA, it could start a major decline. The next support is near the $6,200 area. Besides, there is a crucial bullish trend line forming with support near $6,240 on the hourly chart of the BTC/USD pair.
A clear break below the trend line support will most likely confirm the highlighted double top pattern. In the stated case, the price is likely to dive towards the $6,000 and $5,800 support levels.
Bearish Invalidation
If bitcoin remains well bid above the $6,500 and $6,400 support levels, it could rise above the $7,000 resistance area in the coming sessions.
A successful break and follow through above $7,000 may perhaps negate the double top pattern and the price could surge towards the $7,500 level.
Technical indicators:
Hourly MACD – The MACD is slowly losing momentum in the bullish zone.
Hourly RSI (Relative Strength Index) – The RSI for BTC/USD is currently above the 50 level, with a bearish angle.
Major Support Levels – $6,500 followed by $6,400.
Major Resistance Levels – $6,900, $7,000 and $7,200.