
Reason to trust
How Our News is Made
Strict editorial policy that focuses on accuracy, relevance, and impartiality
Ad discliamer
Morbi pretium leo et nisl aliquam mollis. Quisque arcu lorem, ultricies quis pellentesque nec, ullamcorper eu odio.
Ethereum failed to continue above the $138 and $140 resistance levels against the US Dollar. As a result, ETH price declined below $130 and it is now trading in a bearish zone.
- Ethereum is down more than 8% and it broke the $128 support against the US Dollar.
- There was a key breakdown noted after the price was rejected near the $140 area.
- There is a connecting bearish trend line forming with resistance near $129 on the hourly chart of ETH/USD (data feed via Kraken).
- Bitcoin price is also down more than 5% and it is now trading well below the $6,000 level.
Ethereum Price Starts Fresh Decline
This past week, we saw a nice recovery in Ethereum above the $140 and $145 resistance levels against the US Dollar. ETH price even broke the $150 level, but it failed to continue higher.
A high was formed near $154 and the price started a fresh decline. There was a close below the $140 and $138 support levels, which later acted as a key hurdle for the bulls.
The price is now trading below the $130 support and the 100 hourly simple moving average. During the decline, there was a break below a major bullish trend line with support near $132 on the hourly chart of ETH/USD.
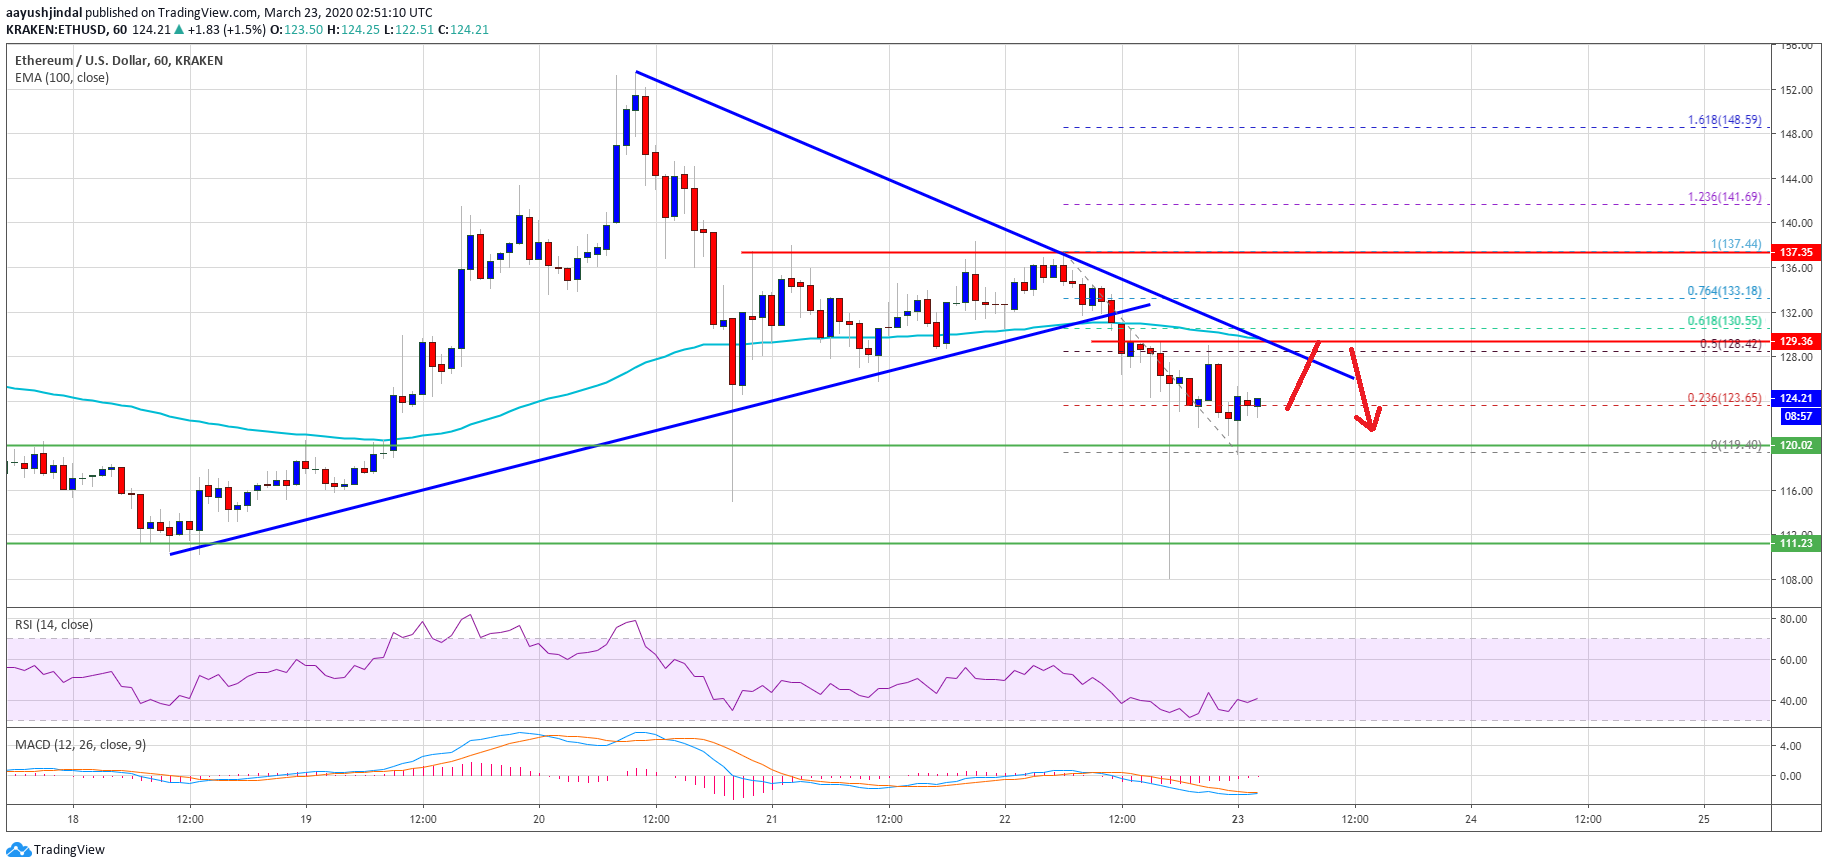
Ethereum tested the $120 support area and it is currently consolidating losses near the 23.6% Fib retracement level of the recent decline from the $137 swing high to $120 low.
On the downside, an initial support is near the $120 level. If the bears succeed in clearing the $120 support, the price could continue to move down. An immediate support is near the $112 level, below which the price is likely to decline towards the $105 support.
Upsides Capped
On the upside, Ethereum is facing many hurdles, starting with $130. There is also a connecting bearish trend line forming with resistance near $129 on the same chart.
Besides, the 100 hourly simple moving average is also positioned near the $130 level to act as a barrier for the bulls. A successful break above the $130 barrier could lead the price towards the $135 and $138 resistance levels in the near term. The main hurdle is now near $140, above which the price is likely to turn positive.
Technical Indicators
Hourly MACD – The MACD for ETH/USD is slowly reducing its last bearish slope.
Hourly RSI – The RSI for ETH/USD is currently correcting higher towards the 45 level.
Major Support Level – $120
Major Resistance Level – $130