
Reason to trust
How Our News is Made
Strict editorial policy that focuses on accuracy, relevance, and impartiality
Ad discliamer
Morbi pretium leo et nisl aliquam mollis. Quisque arcu lorem, ultricies quis pellentesque nec, ullamcorper eu odio.
Bitcoin is struggling to gain momentum above $5,500 resistance against the US Dollar. If BTC price breaks the $5,000 support, it could start a major decline in the near term.
- Bitcoin is currently trading in a range between $5,000 and $5,500 against the US Dollar.
- A break below the $5,000 support could set the stage for a fresh decline.
- There is a key ascending channel forming with support near $5,100 on the hourly chart of the BTC/USD pair (data feed from Kraken).
- The pair could gain bullish momentum if there is a clear break above $5,500 and $5,600.
Bitcoin Stuck In a Range
After a close above the $5,000 pivot level, bitcoin extended its rise against the US Dollar. BTC price traded above the $5,400 resistance and the 100 hourly simple moving average.
However, the price faced a strong selling interest above the $5,500 level. The bulls made a couple of attempts to gain pace above $5,500 and $5,600, but they failed. The last high was near $5,568 and the price is currently correcting lower.
It traded below the 23.6% Fib retracement level of the upward move from the $4,326 low to $5,568 high. The price even spiked below the $5,100 level and the 100 hourly simple moving average.
On the downside, the $5,000 area is acting as a strong support. The 50% Fib retracement level of the upward move from the $4,326 low to $5,568 high is also near the $4,947 level to provide support.
There is also a key ascending channel forming with support near $5,100 on the hourly chart of the BTC/USD pair. Therefore, a downside break below the channel support and the $5,000 support area could start a strong decrease.
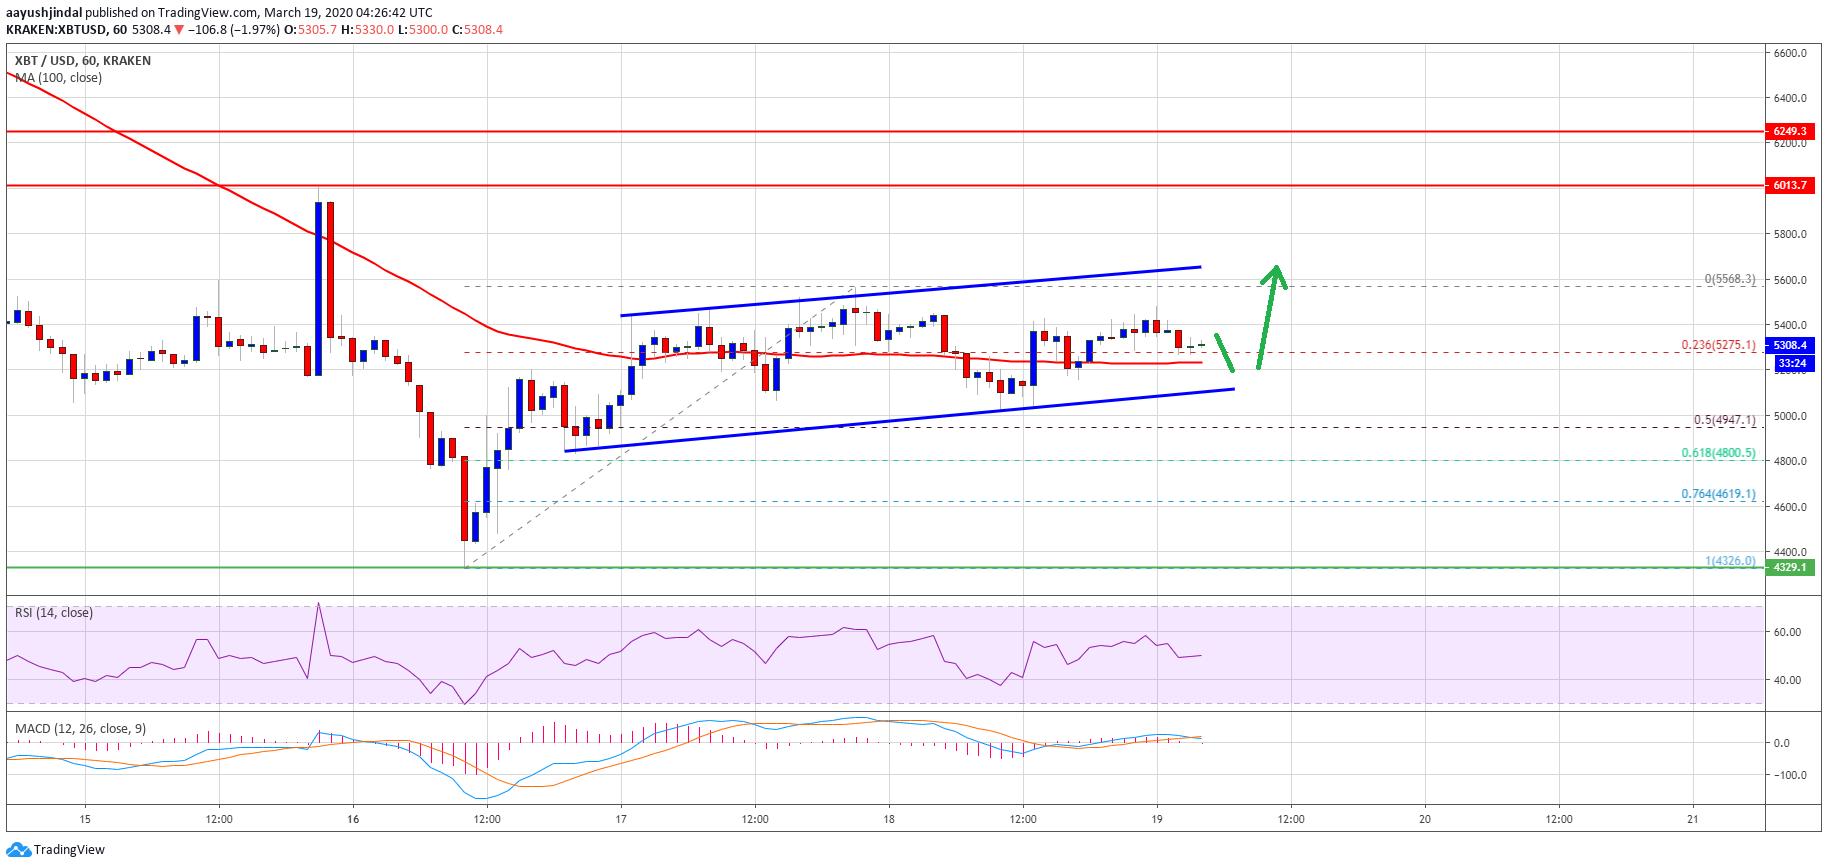
The next support is near the $4,800 level, below which the price may perhaps continue to move down towards the $4,600 and $4,500 levels.
Upside Break?
If bitcoin climbs higher above the $5,500 resistance and the channel upper trend line, the bulls could gain control. The next resistance is near the $5,600 level, above which the bulls are likely to aim a test of the $6,000 resistance in the near term.
The overall structure is slightly negative, but a break below the $5,000 support could put a lot of pressure on the bulls.
Technical indicators:
Hourly MACD – The MACD is about to move into the bearish zone.
Hourly RSI (Relative Strength Index) – The RSI for BTC/USD is currently just above the 50 level.
Major Support Levels – $5,100 followed by $5,000.
Major Resistance Levels – $5,500, $5,600 and $6,000.