
Reason to trust
How Our News is Made
Strict editorial policy that focuses on accuracy, relevance, and impartiality
Ad discliamer
Morbi pretium leo et nisl aliquam mollis. Quisque arcu lorem, ultricies quis pellentesque nec, ullamcorper eu odio.
Ethereum corrected higher after a massive decline towards $90 against the US Dollar, similar to bitcoin. ETH price is struggling to correct above $130 and it could resume its decline.
- ETH price is showing a few bearish signs below the $130 and $140 levels against the US Dollar.
- The price is trading with a bearish angle, with supports near $110 and $105.
- There are two bearish trend lines forming with resistance near $130 and $142 on the 4-hours chart of ETH/USD (data feed via Kraken).
- The pair remains at a risk of more losses towards the $100 support in the near term.
Ethereum Price Turns Red
This past week, Ethereum nosedived below many supports near $150 and $120 against the US Dollar. ETH price even broke the $100 support area and settled well below the 100 simple moving average (4-hours).
The price traded as low as $89 and recently started an upside correction. It managed to recover above the $100 and $110 levels. There was a break above the 23.6% Fib retracement level of the key decline from the $196 high to $89 low.
However, the price is struggling to clear the $130 and $135 resistance levels. There are also two bearish trend lines forming with resistance near $130 and $142 on the 4-hours chart of ETH/USD.
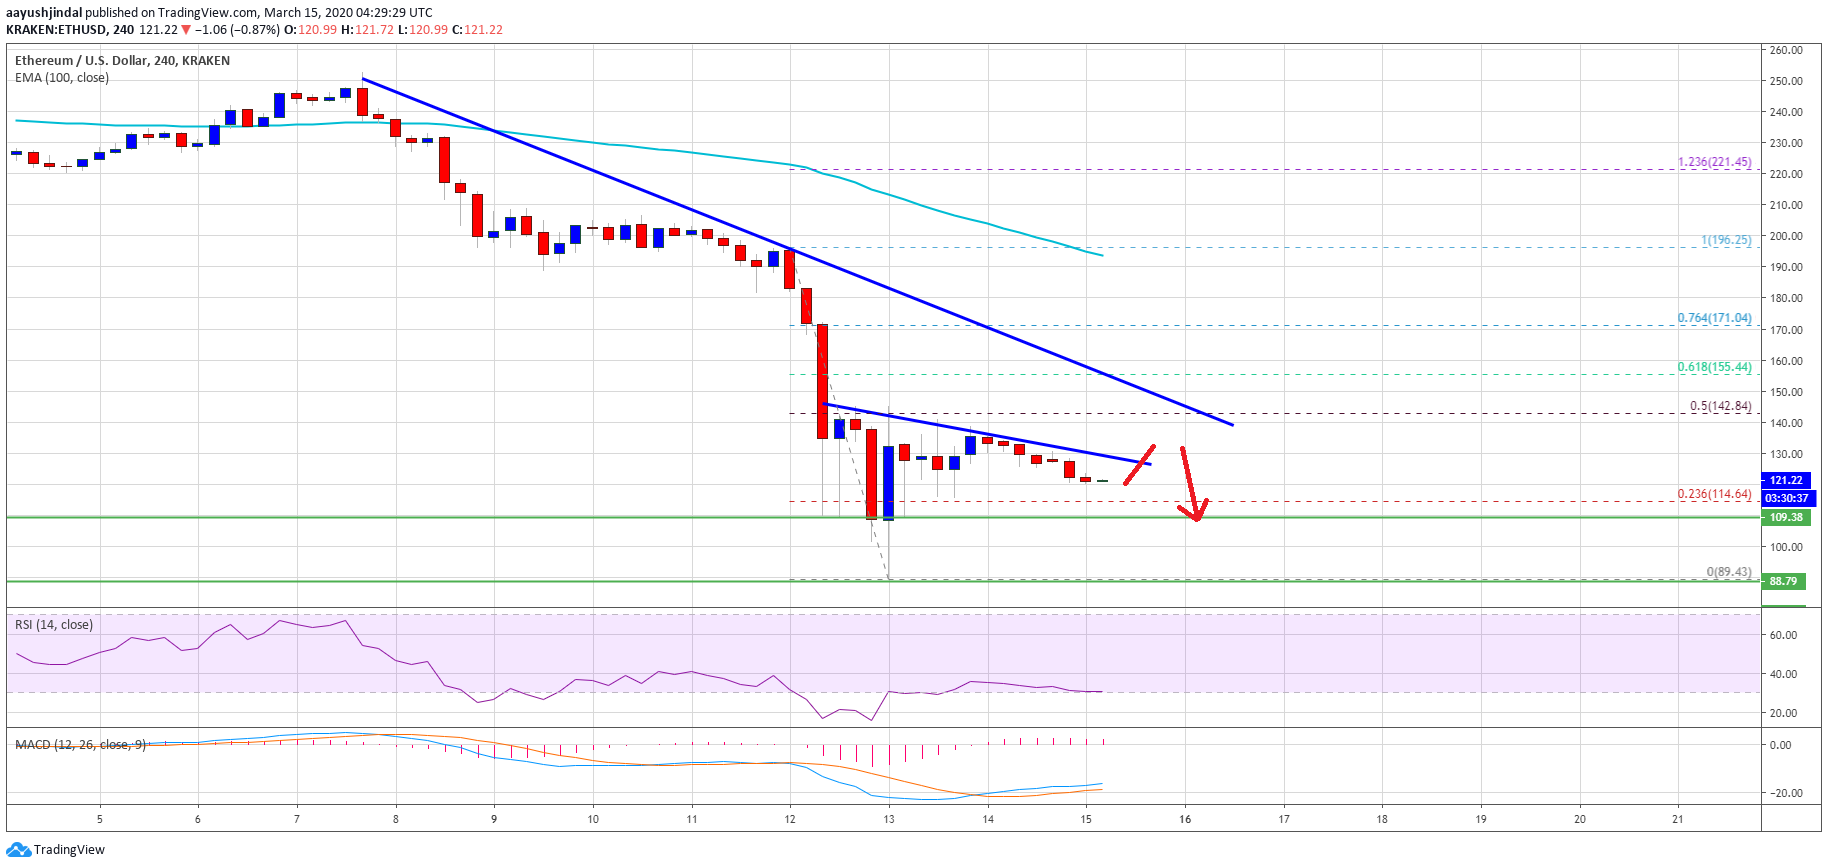
Ethereum is also trading below the 50% Fib retracement level of the key decline from the $196 high to $89 low. The current price action suggests more downsides below the $115 and $110 levels.
The first major support is near the $100 handle. If the bulls struggle to keep the price above the $100 support area, there is a risk of a sharp decline towards the $90 and $85 levels in the near term. Any further losses could spark a panic sell move towards the $65 level.
Chances of a Decent Recovery
On the upside, Ethereum is facing a couple of important hurdles, starting with $130 and $135. The first major barrier for the bulls is near the $142 area.
If the price manages to recover above the $142 resistance area, it could start a decent recovery. In the mentioned case, the bulls are likely to aim a test of the $155 resistance. Any further gains may perhaps lead the price towards the $170 level or the 100 simple moving average (4-hours).
Technical Indicators
4 hours MACD – The MACD for ETH/USD is slowly moving in the bullish zone.
4 hours RSI – The RSI for ETH/USD is now just above the 30 level.
Major Support Level – $110
Major Resistance Level – $142