
Reason to trust
How Our News is Made
Strict editorial policy that focuses on accuracy, relevance, and impartiality
Ad discliamer
Morbi pretium leo et nisl aliquam mollis. Quisque arcu lorem, ultricies quis pellentesque nec, ullamcorper eu odio.
Ripple is down more than 50% in a day and broke the $0.1500 support against the US Dollar. XRP price tested the $0.1200 support area and it is currently showing a few recovery signs.
- Ripple price is down more than $0.1000 and it recently tested the $0.1200 support against the US dollar.
- The price is currently correcting higher from the $0.1174 swing low.
- There is a major bearish trend line forming with resistance near $0.1900 on the 4-hours chart of the XRP/USD pair (data source from Kraken).
- The price might resume its decline if it fails to recover above the $0.1650 and $0.1700 resistance levels.
Ripple Price Testing Key Support
In the past three sessions, ripple saw a monstrous decline from well above $0.2000. XRP price declined more than 50% and broke many key supports near $0.1800 and $0.1650 to enter a medium term downtrend.
The decline was such that the price even broke the $0.1500 support and settled well below the 100 simple moving average (4-hours). Finally, it tested the key $0.1200 support area and a new multi-month low was formed near the $0.1174 level.
Ripple is currently correcting higher and trading above the $0.1400 level. It is trading above the 23.6% Fib retracement level of the recent decline from the $0.2160 high to $0.1174 low.
On the upside, an initial resistance is near the $0.1650 level. The 50% Fib retracement level of the recent decline from the $0.2160 high to $0.1174 low is also near the $0.1667 level to act as a major hurdle for the bulls.
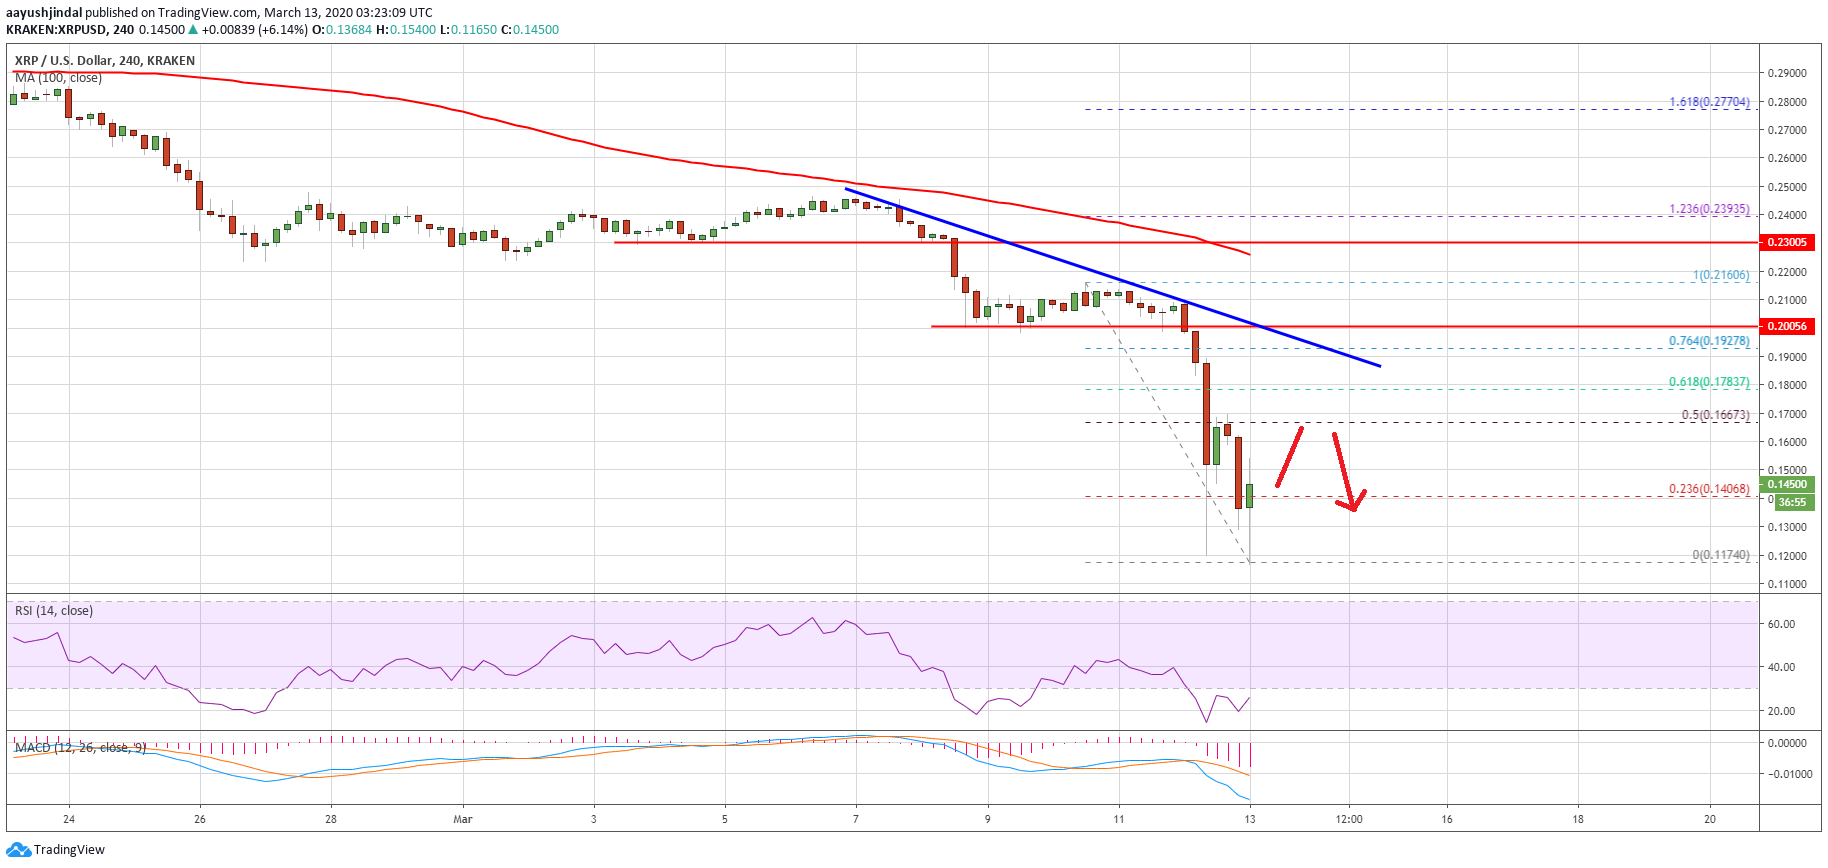
More importantly, there is a major bearish trend line forming with resistance near $0.1900 on the 4-hours chart of the XRP/USD pair. Therefore, the pair must recover above the $0.1650 and $0.1900 resistance levels to move back into a positive zone.
What if Recovery Fails?
Clearly, the $0.1200 support is very important. Ripple is currently showing a few positive signs above $0.1400. However, the $0.1650 resistance zone could be a key barrier for the bulls.
If they fail to overcome the $0.1650 hurdle, the price may perhaps resume its decline. The first support on the downside is near the $0.1320 level. The main support is near the $0.1200 level, below which the price could test the $0.1000 level.
Technical Indicators
4-Hours MACD – The MACD for XRP/USD is about to move back into the bullish zone.
4-Hours RSI (Relative Strength Index) – The RSI for XRP/USD is currently correcting high towards the 40 level.
Major Support Levels – $0.1320, $0.1200 and $0.1100.
Major Resistance Levels – $0.1650, $0.1800 and $0.1900.


