
Reason to trust
How Our News is Made
Strict editorial policy that focuses on accuracy, relevance, and impartiality
Ad discliamer
Morbi pretium leo et nisl aliquam mollis. Quisque arcu lorem, ultricies quis pellentesque nec, ullamcorper eu odio.
Ripple is currently correcting higher from the $0.1981 monthly low against the US Dollar. XRP price must break $0.2100 and $0.2150 to start a strong recovery in the near term.
- Ripple price is currently consolidating above the $0.2000 pivot level against the US dollar.
- The price is facing a lot of hurdles near the $0.2100 and $0.2150 levels.
- There is a key bearish trend line forming with resistance near $0.2085 on the hourly chart of the XRP/USD pair (data source from Kraken).
- The price could correct higher towards $0.2150, above which it might surge towards $0.2250.
Ripple Price Could Recover in the Short Term
Yesterday, we saw a sharp decline in ripple below the $0.2200 and $0.2050 support levels. XRP price even dived below the key $0.2000 support level and settled well below the 100 hourly simple moving average.
A new monthly low is formed near the $0.1981 level and the price is currently correcting higher. It is back above the $0.2000 level, but facing a lot of hurdles.
An initial resistance is near the 23.6% Fib retracement level of the recent drop from the $0.2450 high to $0.1981 low. More importantly, there is a key bearish trend line forming with resistance near $0.2085 on the hourly chart of the XRP/USD pair.
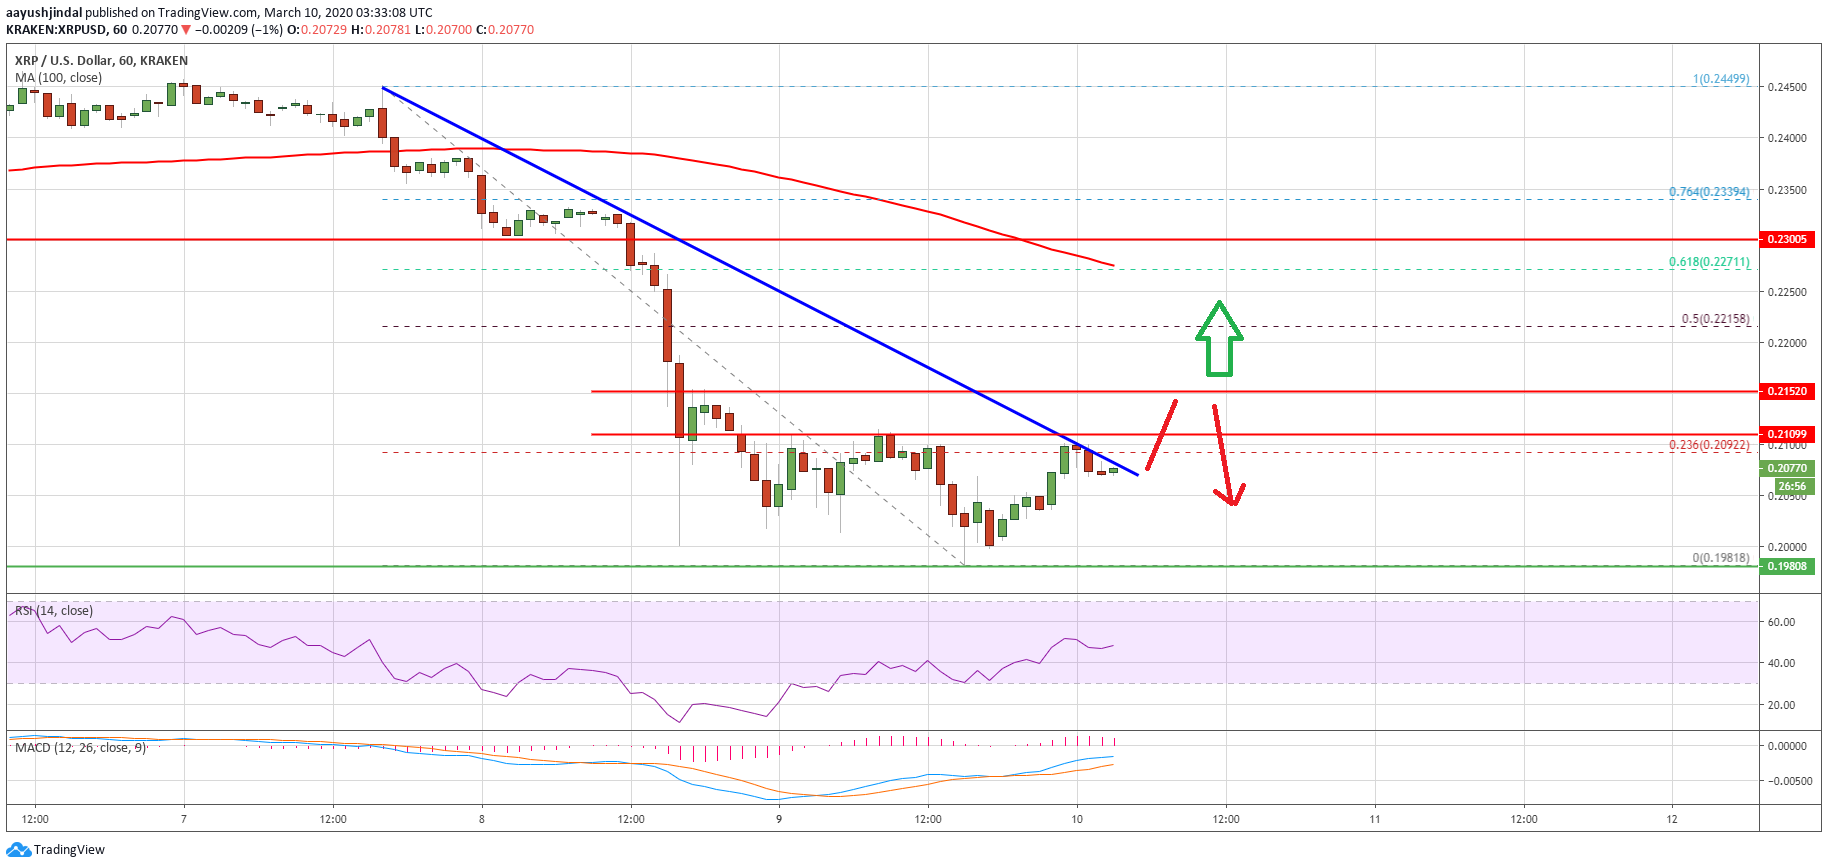
If there is an upside break above the trend line, ripple price might recover towards the $0.2150 resistance. A successful break above the $0.2150 level could start a strong recovery in the coming sessions.
The next major resistance is near the $0.2215 level since it is close to the 50% Fib retracement level of the recent drop from the $0.2450 high to $0.1981 low. Any further gains will most likely lead the price towards the $0.2280 resistance level and the 100 hourly SMA. An intermediate resistance is near the $0.2250 level.
Another Failure?
If ripple fails to correct above the $0.2100 and $0.2150 resistance levels, it is likely to resume its decline. An initial support is near the key $0.2000 pivot area.
A clear break and close below the $0.2000 support area may perhaps spark a sharp decline. The next support is near the $0.1981 low, below which there is a risk of a drop towards the $0.1920 level in the near term.
Technical Indicators
Hourly MACD – The MACD for XRP/USD is slowly moving in the bullish zone.
Hourly RSI (Relative Strength Index) – The RSI for XRP/USD is currently recovering and it is near the 50 level.
Major Support Levels – $0.2040, $0.2020 and $0.2000.
Major Resistance Levels – $0.2100, $0.2120 and $0.2150.


