Reason to trust
How Our News is Made
Strict editorial policy that focuses on accuracy, relevance, and impartiality
Ad discliamer
Morbi pretium leo et nisl aliquam mollis. Quisque arcu lorem, ultricies quis pellentesque nec, ullamcorper eu odio.
Ripple is down more than 10% and it tagged the $0.2000 support against the US Dollar. XRP price is currently correcting higher, but upsides are likely to remain capped near $0.2150.
- Ripple price is showing a lot of bearish signs below the $0.2200 and $0.2150 levels against the US dollar.
- The price tested the $0.2000 support area and it remains at a risk of more losses.
- There is a major contracting triangle forming with support near $0.2038 on the hourly chart of the XRP/USD pair (data source from Kraken).
- The price could correct higher, but it is likely to face a strong selling interest near $0.2150.
Ripple Price Eyeing Fresh Increase
Ripple started a major decline from well above the $0.2300 support. XRP price followed a bearish path similar to bitcoin and Ethereum to settle well below the 100 hourly simple moving average.
The recent decline was such that the bears took the price below the $0.2150 support area. It tested the $0.2000 support level and a new monthly low is formed near $0.1998.
Ripple is currently correcting higher and trading above the $0.2040 level. Besides, it is testing the 23.6% Fib retracement level of the recent dive from the $0.2449 high to $0.1998 low.
On the upside, there are many hurdles forming near the $0.2100 and $0.2120 levels. There is also a major contracting triangle forming with support near $0.2038 on the hourly chart of the XRP/USD pair.
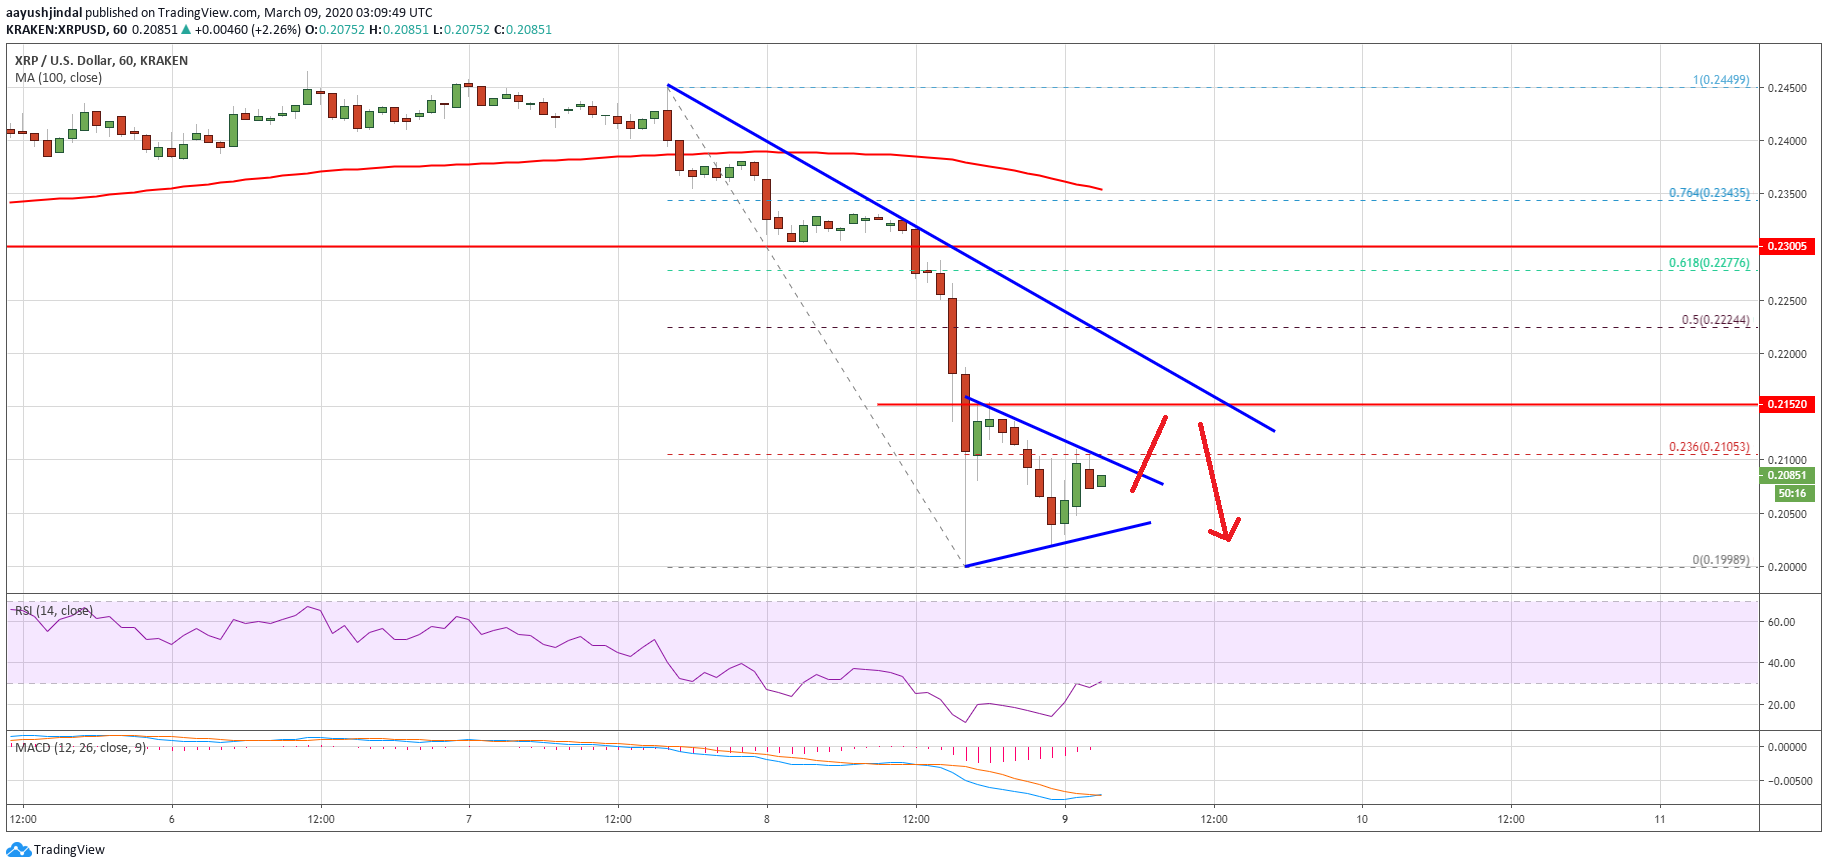
If the pair breaks the triangle support and $0.2030, there are chances of more losses in the near term. The main support is near the $0.2000 area, below which the bears are likely to aim a test of the $0.1880 support area.
Recovery Could Be Capped
If ripple starts an upside correction above the $0.2100 resistance, it could test the key $0.2150 resistance area. There is also a crucial bearish trend line forming with resistance near $0.2160 on the same chart.
Above the trend line resistance, the 50% Fib retracement level of the recent dive from the $0.2449 high to $0.1998 low is near the $0.2220 area. Therefore, a decent recovery in ripple requires a solid break above the $0.2150 resistance and a follow through above the $0.2200 level.
If not, the bears are likely to aim more losses below the $0.2020 and $0.2000 support levels in the coming sessions.
Technical Indicators
Hourly MACD – The MACD for XRP/USD is slowly recovering and it could move into the bullish zone.
Hourly RSI (Relative Strength Index) – The RSI for XRP/USD is currently correcting higher towards the 40 level.
Major Support Levels – $0.2040, $0.2020 and $0.2000.
Major Resistance Levels – $0.2100, $0.2120 and $0.2150.


