
Reason to trust
How Our News is Made
Strict editorial policy that focuses on accuracy, relevance, and impartiality
Ad discliamer
Morbi pretium leo et nisl aliquam mollis. Quisque arcu lorem, ultricies quis pellentesque nec, ullamcorper eu odio.
Bitcoin finally managed to clear the $9,000 resistance zone against the US Dollar. BTC price must stay above the $8,950 and $8,860 support levels to continue higher in the near term.
- Bitcoin is trading in a positive zone above the $8,950 and $9,000 levels against the US Dollar.
- The price traded as high as $9,172 and it is currently correcting lower.
- There is a key bullish trend line forming with support near $8,860 on the hourly chart of the BTC/USD pair (data feed from Kraken).
- The pair could correct a few points, but it is likely to bounce back from $8,950 or $8,860.
Bitcoin Struggling To Gain Pace
After many failed attempts, bitcoin finally managed to pop above the $8,950 and $9,000 resistance levels against the US Dollar. BTC price settled nicely above the $9,000 level and the 100 hourly simple moving average.
A new weekly high is formed near $9,172 and the price is currently correcting lower. The current technical structure suggests that the price is lacking strength above $9,000.
It declined below the 23.6% Fib retracement level of the upward move from the $8,670 low to $9,172 high. However, the bulls need not to worry just yet as there are many supports on the downside near the $9,000 and $8,950 levels.
The first key support is near the $8,950 level (the recent breakout zone). The next key support is near the $8,920 level. It coincides with the 50% Fib retracement level of the upward move from the $8,670 low to $9,172 high.
More importantly, there is key bullish trend line forming with support near $8,860 on the hourly chart of the BTC/USD pair. If bitcoin price slides below the $9,000 and $8,950 support levels, there are high chances of it finding a strong buying interest near the trend line and the 100 hourly SMA.
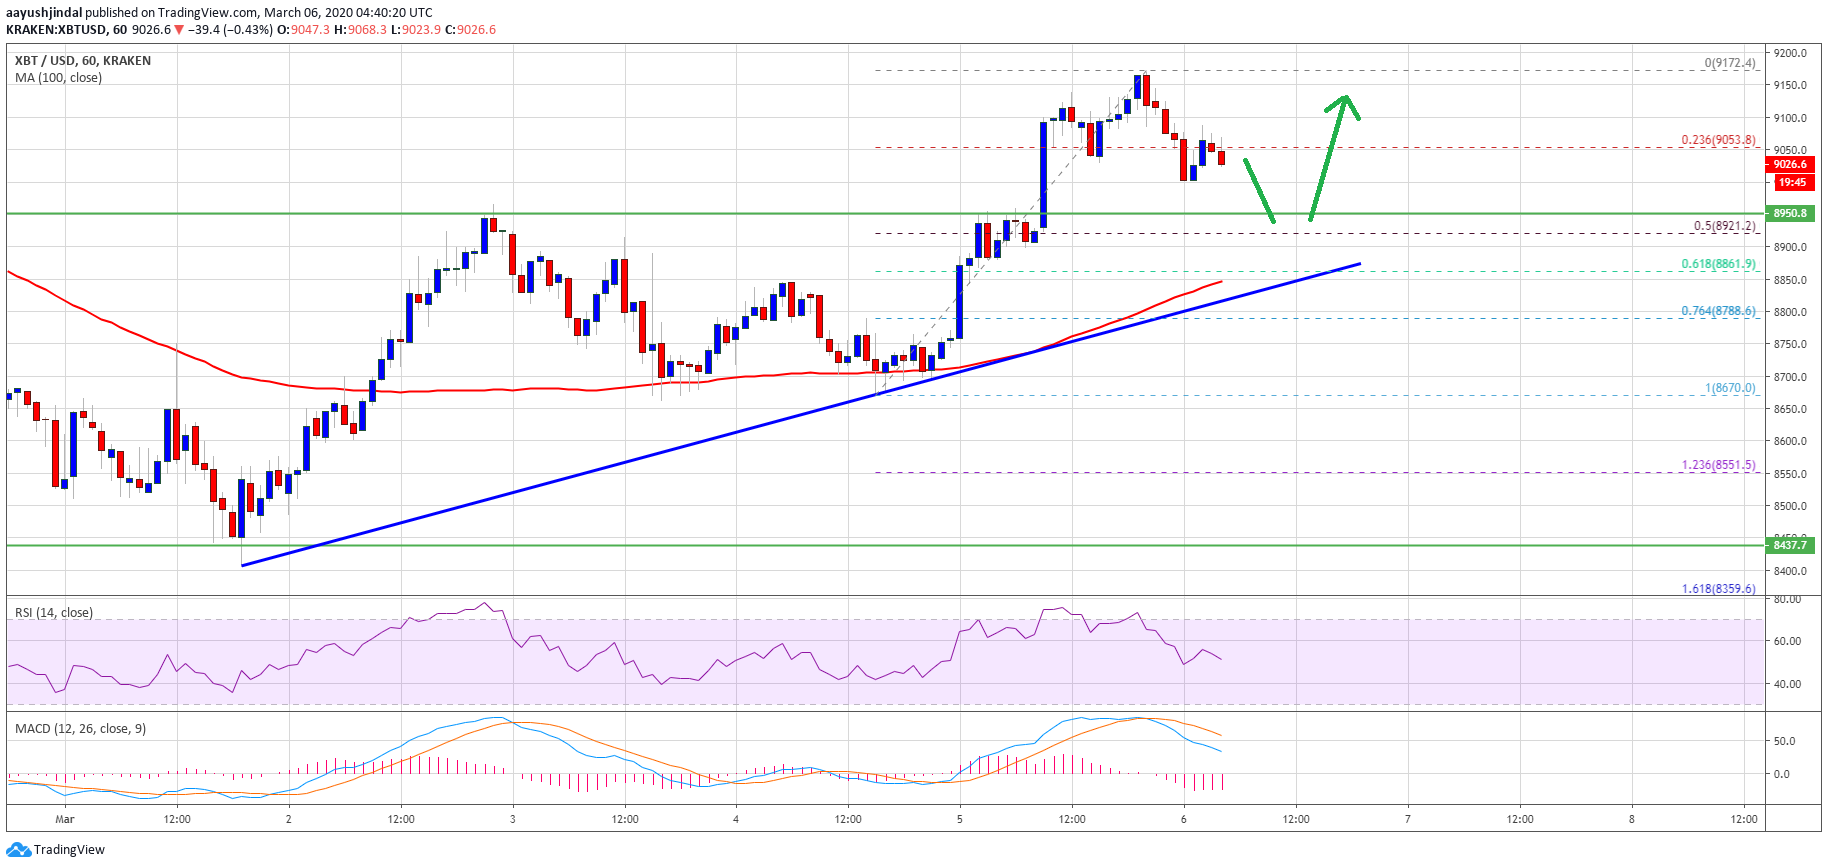
On the upside, an initial resistance is near the $9,100 level. The first major barrier for the bulls is near the $9,200 level, above which they are likely to aim a test of the main $9,500 resistance area.
Chances of Downside Break
The trend line support near $8,860 and the 100 hourly simple moving average are very important for the current wave. If bitcoin price slides below the trend line, there is a risk of a fresh bearish wave below $8,800.
The key support below $8,800 is near the $8,700 level. Any further losses could open the gates for a push towards the $8,500 level in the near term.
Technical indicators:
Hourly MACD – The MACD is about to move back into the bullish zone.
Hourly RSI (Relative Strength Index) – The RSI for BTC/USD is still well above the 50 level.
Major Support Levels – $8,950 followed by $8,860.
Major Resistance Levels – $9,100, $9,200 and $9,500.