
Reason to trust
How Our News is Made
Strict editorial policy that focuses on accuracy, relevance, and impartiality
Ad discliamer
Morbi pretium leo et nisl aliquam mollis. Quisque arcu lorem, ultricies quis pellentesque nec, ullamcorper eu odio.
Ripple is trading nicely above the $0.2320 support area against the US Dollar. XRP price broke a technical pattern, suggesting a decent increase towards $0.2400 and $0.2500 in the near term.
- Ripple price tested the $0.2300 support level and it is currently rising against the US dollar.
- The price is back above the $0.2320 pivot level and trading with a positive bias.
- There was a break above a key bullish flag pattern with resistance near $0.2345 on the hourly chart of the XRP/USD pair (data source from Kraken).
- The price is likely to continue higher towards $0.2400 and $0.2500 if it clears the $0.2370 resistance.
Ripple Price Showing Positive Signs
Yesterday, we saw a decent recovery in ripple above the $0.2350 resistance level. XRP price even traded above the $0.2400 level and the 100 hourly simple moving average. A swing high was formed near $0.2415 and the price corrected lower.
It traded below the 50% Fib retracement level of the rise from the $0.2238 low to $0.2417 high. However, the bulls were able to protect the $0.2300 support level.
The price is currently rising and it is trading above the $0.2320 level. There was a break above a key bullish flag pattern with resistance near $0.2345 on the hourly chart of the XRP/USD pair.
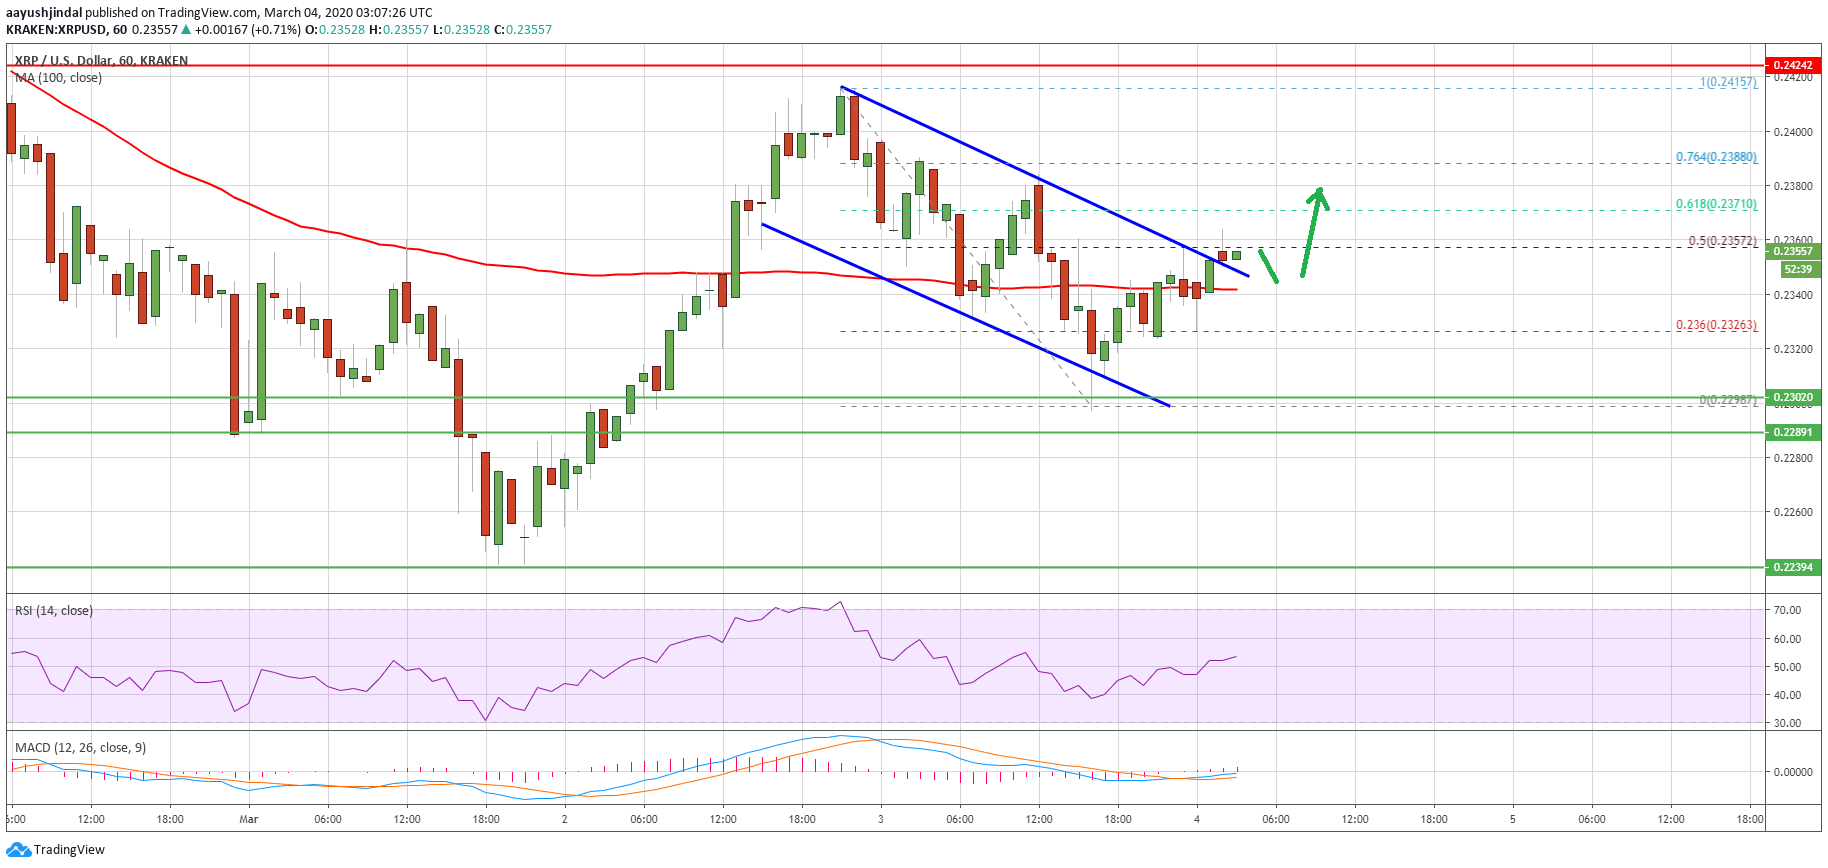
The pair is now testing the 50% Fib retracement level of the downside correction from the $0.2415 high to $0.2298 low. If ripple breaks the $0.2360 and $0.2370 resistance levels, it could start a fresh increase in the near term.
An immediate resistance is near the $0.2400 level, followed by the $0.2415 high. A successful break above the $0.2415 high could open the doors for a larger rally towards the $0.2500 resistance level in the near term.
Another Dip?
If ripple fails to climb above the $0.2360 and $0.2370 resistance levels, it could dip a few points. An initial support is near the $0.2340 level and the 100 hourly simple moving average.
The first key support is near the $0.2320 level, below which the price is likely to retest the $0.2300 support. Any further losses may perhaps put the bulls under a lot of pressure and the price could slide towards the $0.2220 level.
Technical Indicators
Hourly MACD – The MACD for XRP/USD is now gaining pace in the bullish zone.
Hourly RSI (Relative Strength Index) – The RSI for XRP/USD is back above the 50 level, with a few positive signs.
Major Support Levels – $0.2320, $0.2300 and $0.2240.
Major Resistance Levels – $0.2370, $0.2400 and $0.2500.